

Three delayed draw facilities in one hundred and thirty days priced the same thing three times, and the number that moved most was not the interest rate. Set beside what the capital already in has returned, and beside the supplier that sells the equipment all of it buys, the three say something plainer than a credit story.
We came to CoreWeave in the spring with two questions, and neither of them was about CoreWeave. We wanted to know what a pure-play neocloud could tell us about circular financing, and what it could tell us about the quality of cash. It seemed like the right specimen: one business, one product, no legacy monopoly to blend the answer into.
The answers took us somewhere we did not expect, into economic and financial rationales, into houses and players, and, not at all to our surprise by the end, back to circular financing. This is our last piece on the company, and the second half of it is where the questions land.
Two disclosures first, one about the company and one about us.
Nothing here identifies an error or an inconsistency, and we did not go looking for one. Advance rates move, spreads move, and a borrower that agrees to changed terms has agreed to terms. An equity cure right is ordinary in project finance and says nothing unusual about this borrower.
The ladder and the return calculation below are ours. The filings do not present a list of funding sources in order, and they do not compute a return on invested capital. Grouping the sources and building the ratio are both choices we made, and we have set them out so anyone can rebuild or disagree with them. Every figure carries its source, every quotation carries its section, and the accessions are public.
What the next dollar costs
The three loans are the clearest thing in the record, and all three are filed. Each one lends against equipment, and each one states, in its own definitions, what fraction of that equipment it will lend against. That fraction is the advance rate, and it turns out to be the number worth watching.
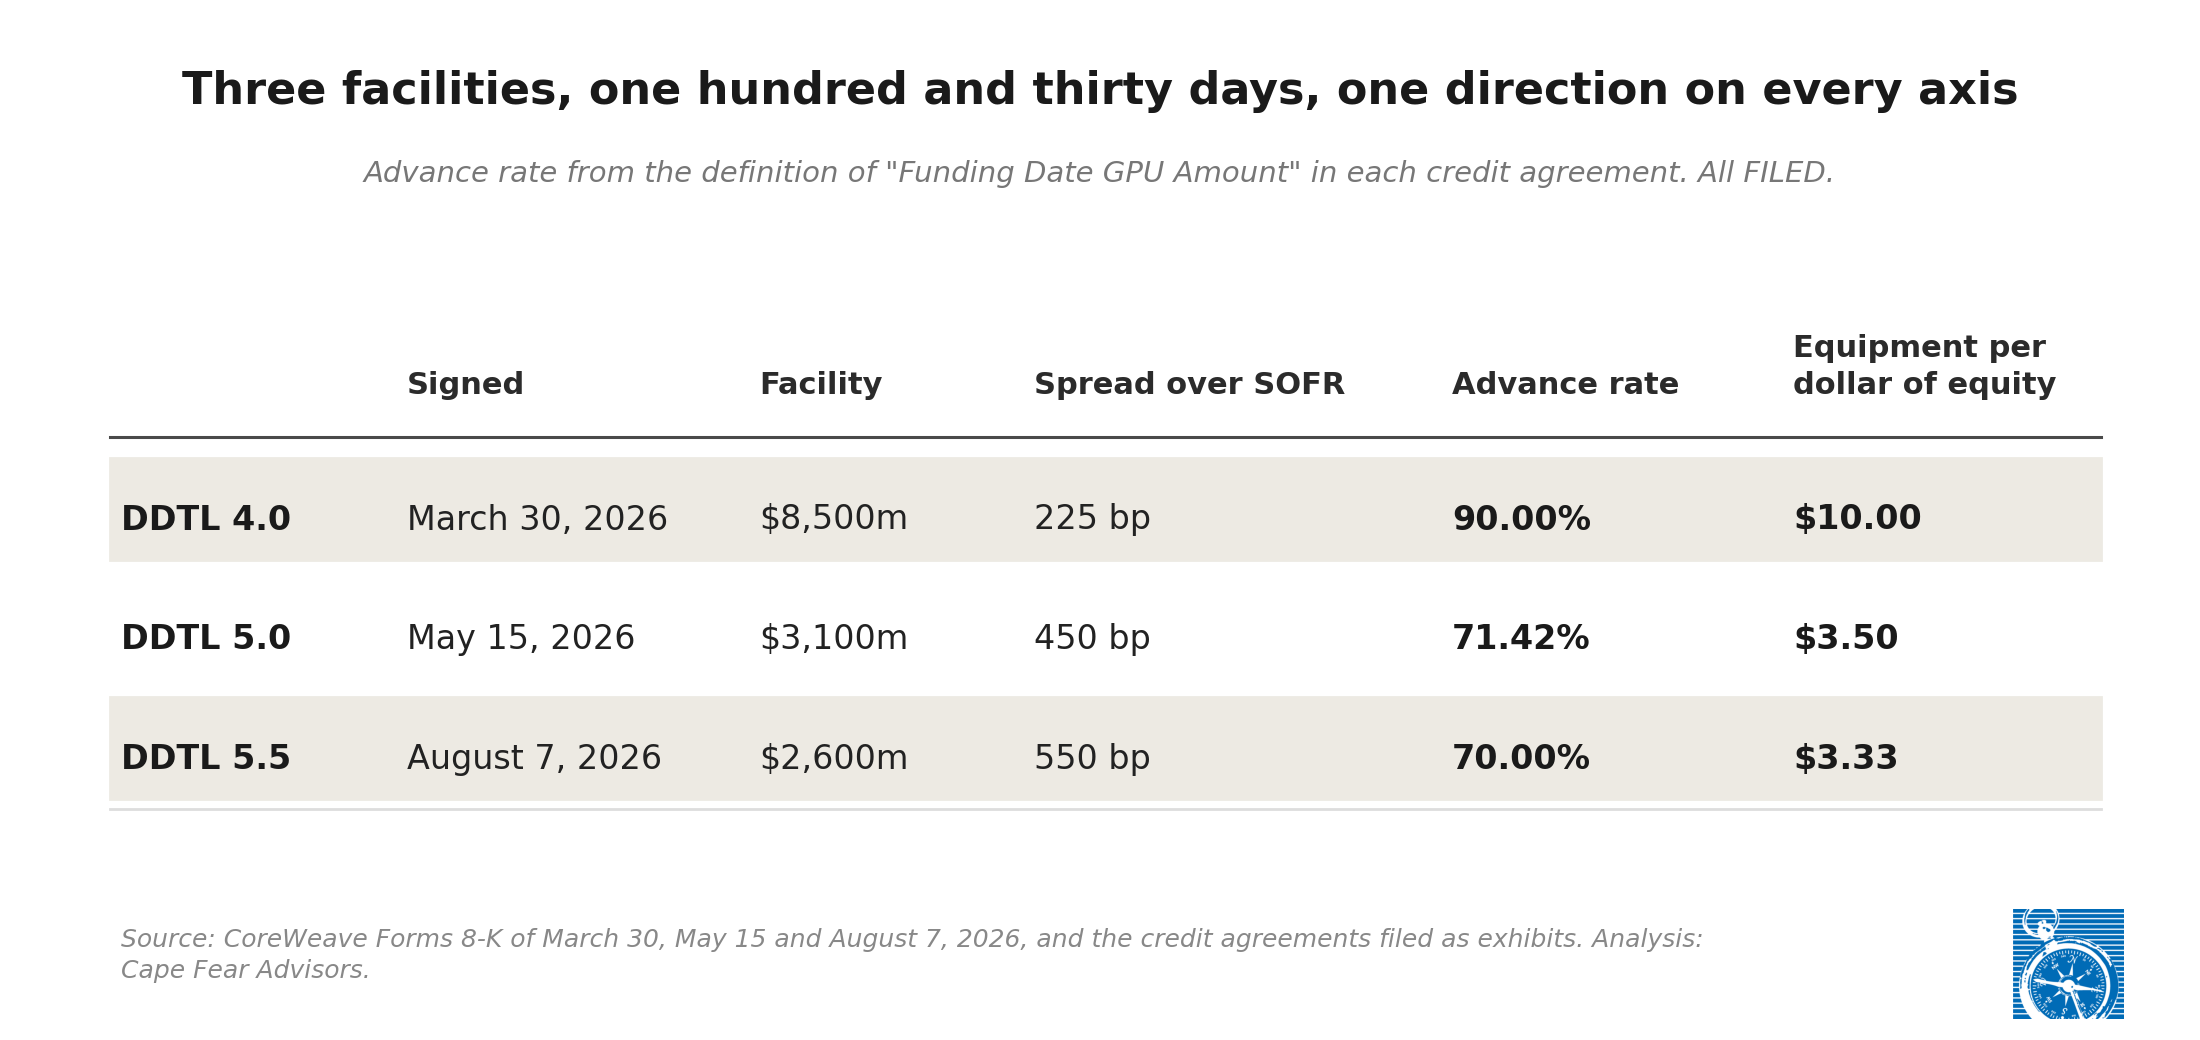
The facility got smaller by 69 percent. The spread more than doubled. And the equity required per dollar of equipment tripled.
The spread changes the price of the debt. The advance rate changes how much debt exists. A dollar of the company’s own money bought ten dollars of equipment in March and buys three dollars and thirty-three cents in August.
An advance rate is a cash-to-program ratio with a signature on it
We published a ratio earlier this summer, cash on hand against the annual capital program, and it ran near one to fifteen at March 31 and near one to six at June 30. That measure is OURS, and it describes what the company chose to hold.
An advance rate measures the same thing, and a lender sets it. At an advance of 90 percent the borrower brings ten cents of its own money for every dollar of equipment, which is one to ten. At 70 percent it brings thirty cents, which is one to three and a third.
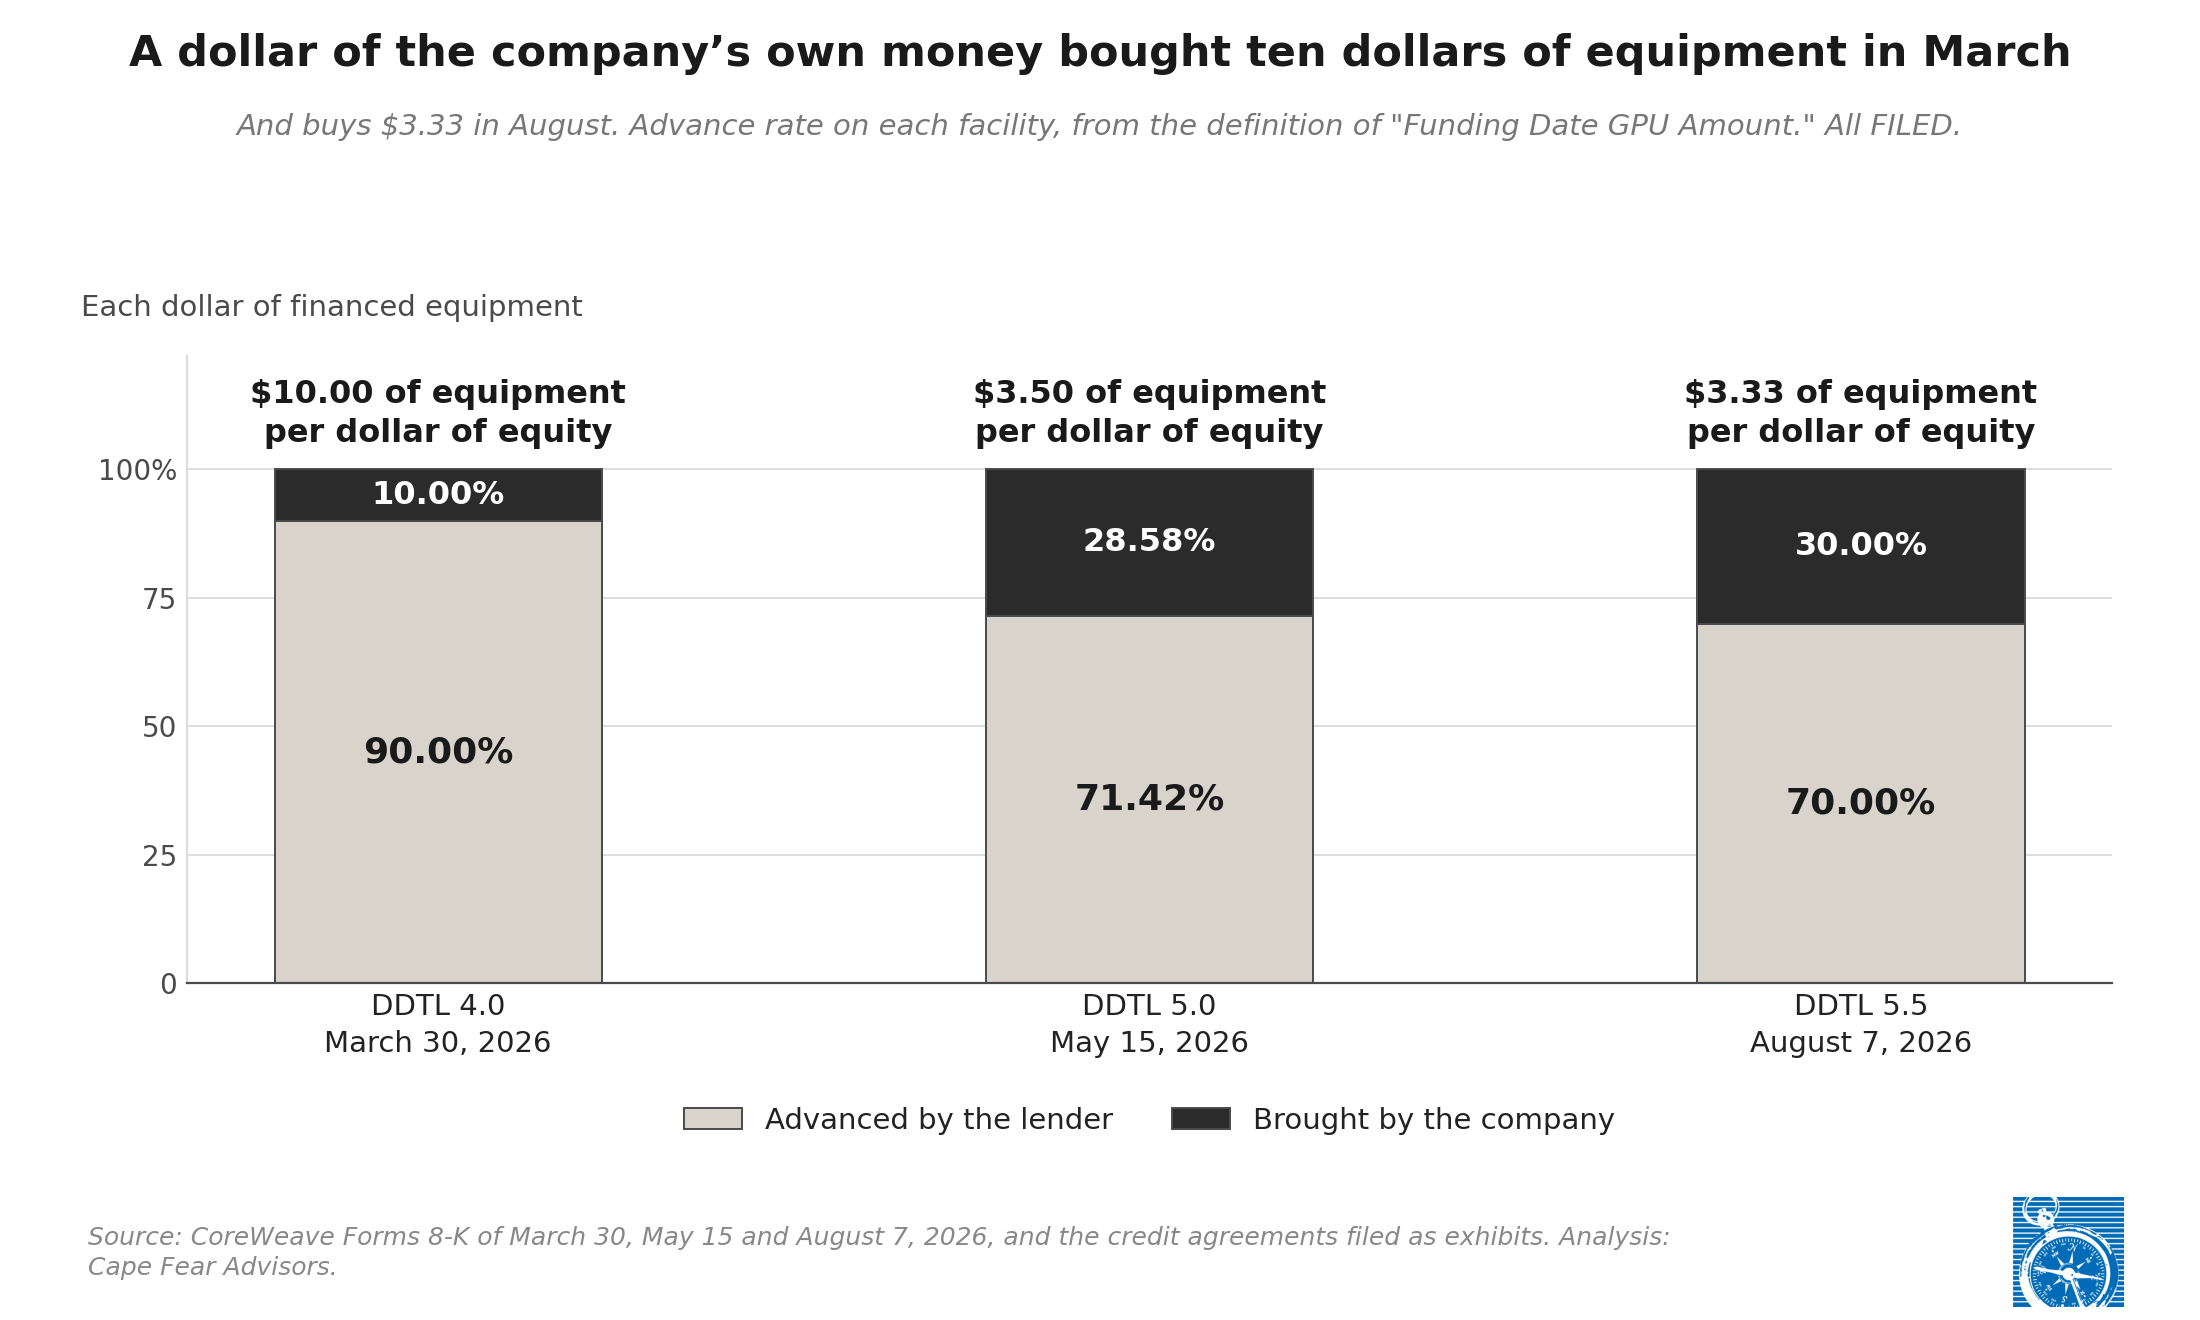
Placed on one axis, the two measures move the same way, with the lenders moving further. The company’s ratio went from about one to fifteen to about one to six across two quarters. The contractual ratio went from one to ten to one to three and a third across five months, and it has been tighter than the company’s own position at every point along the way.
The advance rate governs only the equipment those facilities finance, so reading it as a company-wide requirement would overreach. As an illustration and nothing more, holding the whole 2026 program to the August standard would call for $10.5bn to $11.7bn of cash against $5,524m held at June 30.
What that does to the alternation
The year so far has gone equity, debt, debt, equity, debt, debt, debt. Seven capital events in one hundred and ninety-six days, all filed: a placement in January, a facility in March, notes in April, a placement in April, a facility in May, notes in June, a facility in August.
Setting the equity raised in each window against the slice the next facility requires gives the ratio below, where the slice is the facility size divided by its advance rate, less the facility size. The measure is OURS; both inputs are filed.
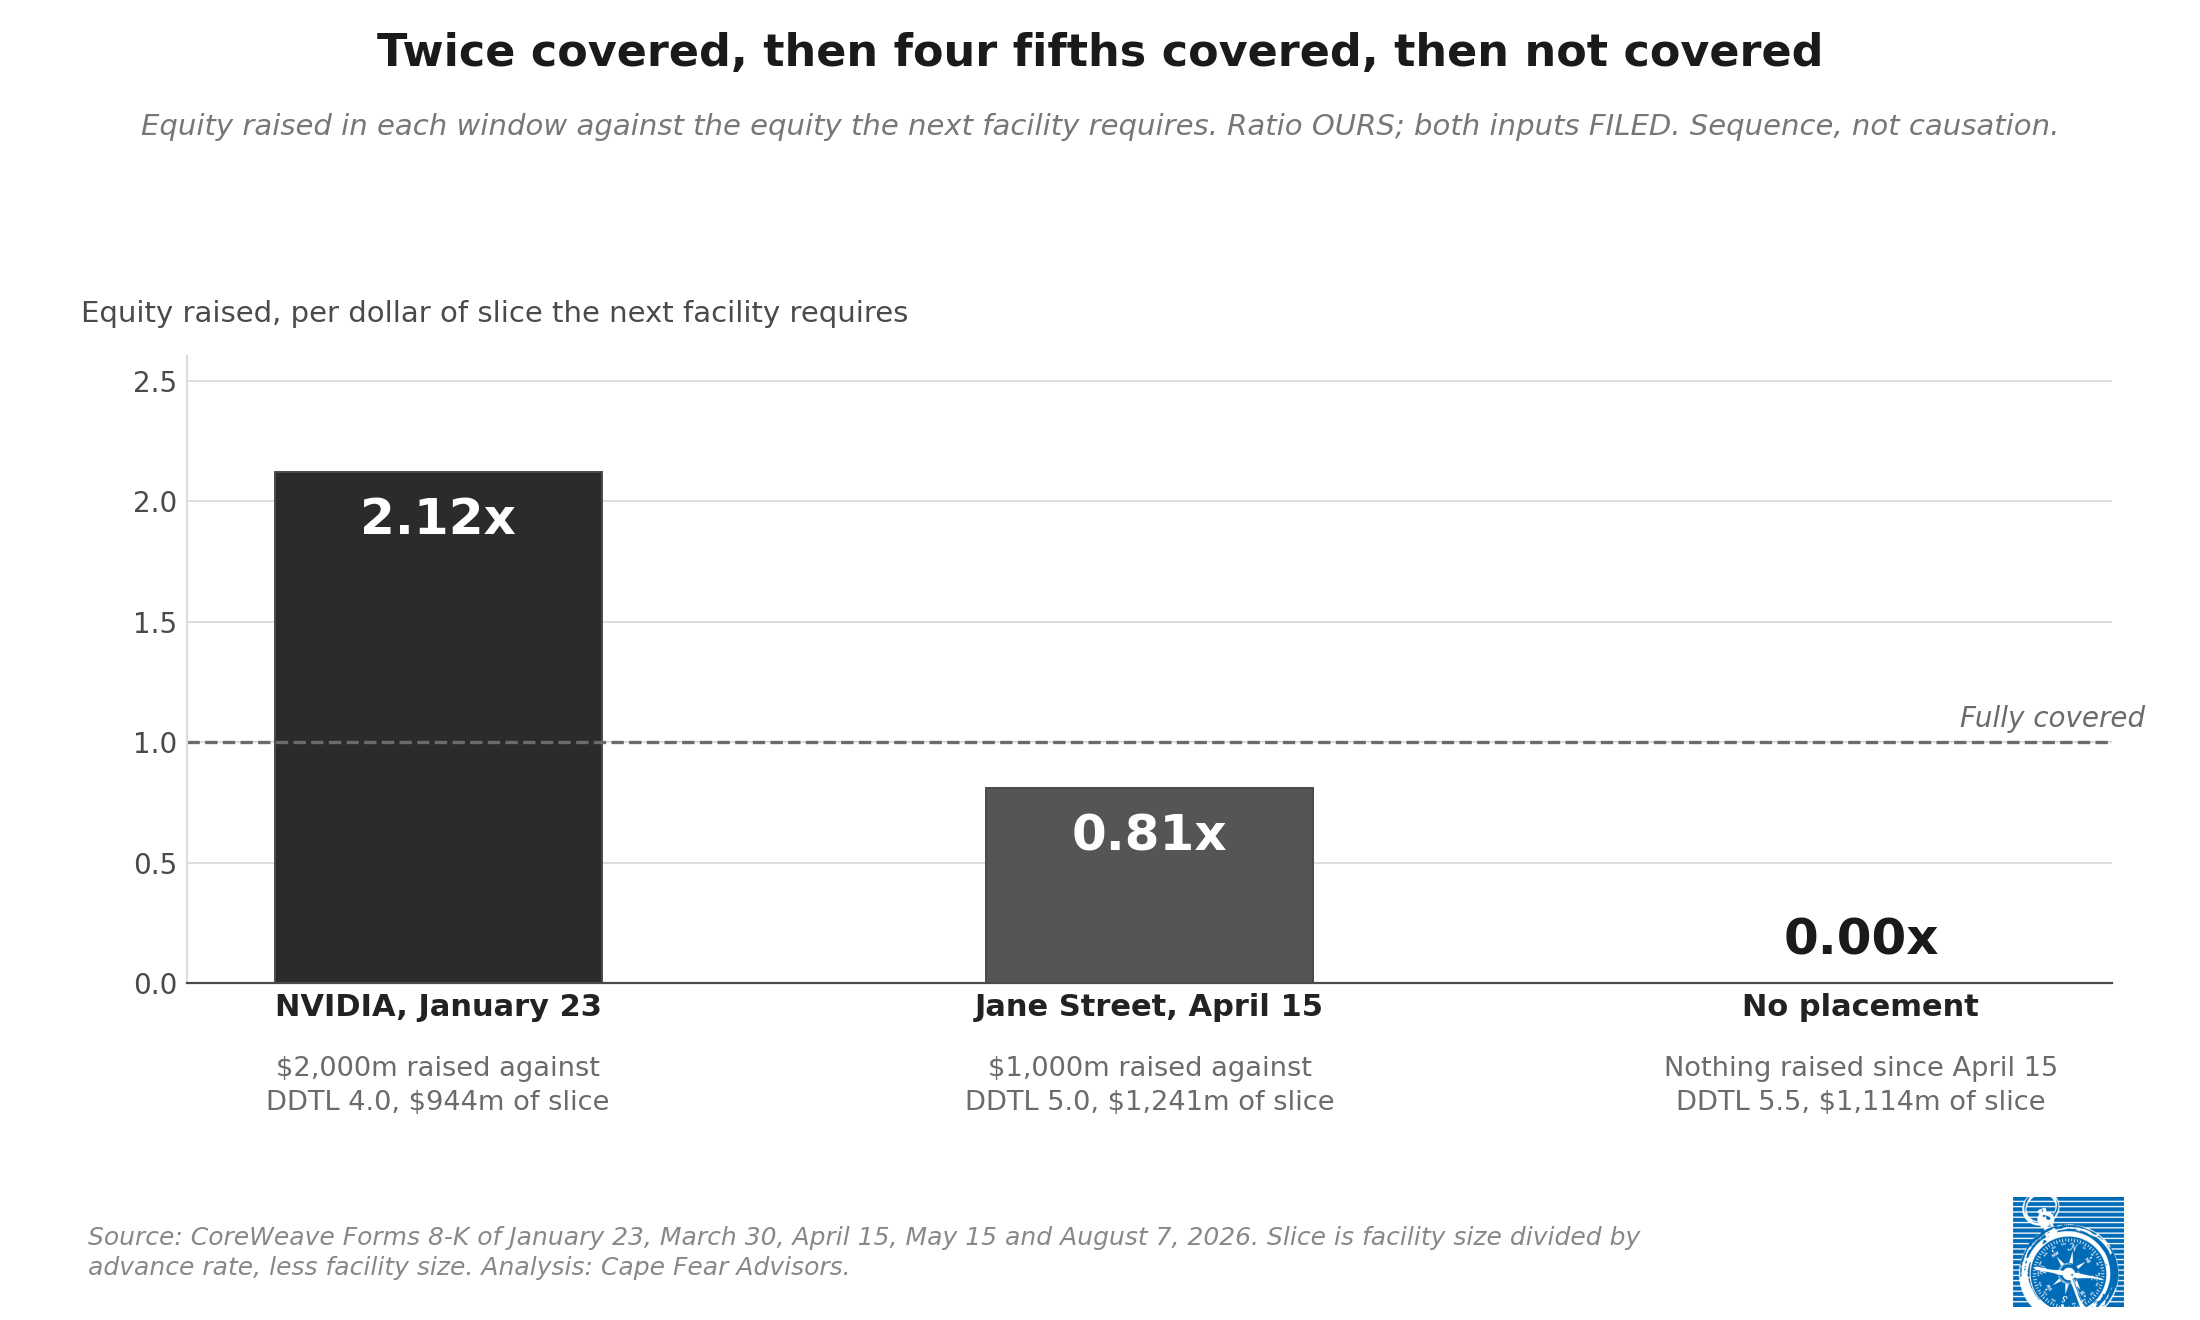
Twice covered, then four fifths covered, then not covered.
The measure does not trace dollars and does not assert that either placement was raised for the facility that followed it. The filings do not permit that. It is a ratio between two filed quantities, and the sequence between them is a sequence.
Two things moved in opposite directions to produce it. The slice per dollar of debt tripled. And the pace of equity raising went from $3,000m in three months to nothing in four.
So growth is rationed by the slice
$10,199m of committed delayed draw capacity remains undrawn. Drawing it in full requires $2,536m of equity beside it, and the requirement has to be built facility by facility, because a blended rate misstates it: $622m against DDTL 4.0’s $5,600m, $800m against DDTL 5.0’s $1,999m, $1,114m against DDTL 5.5’s $2,600m.
Two of those commitments expire this year.
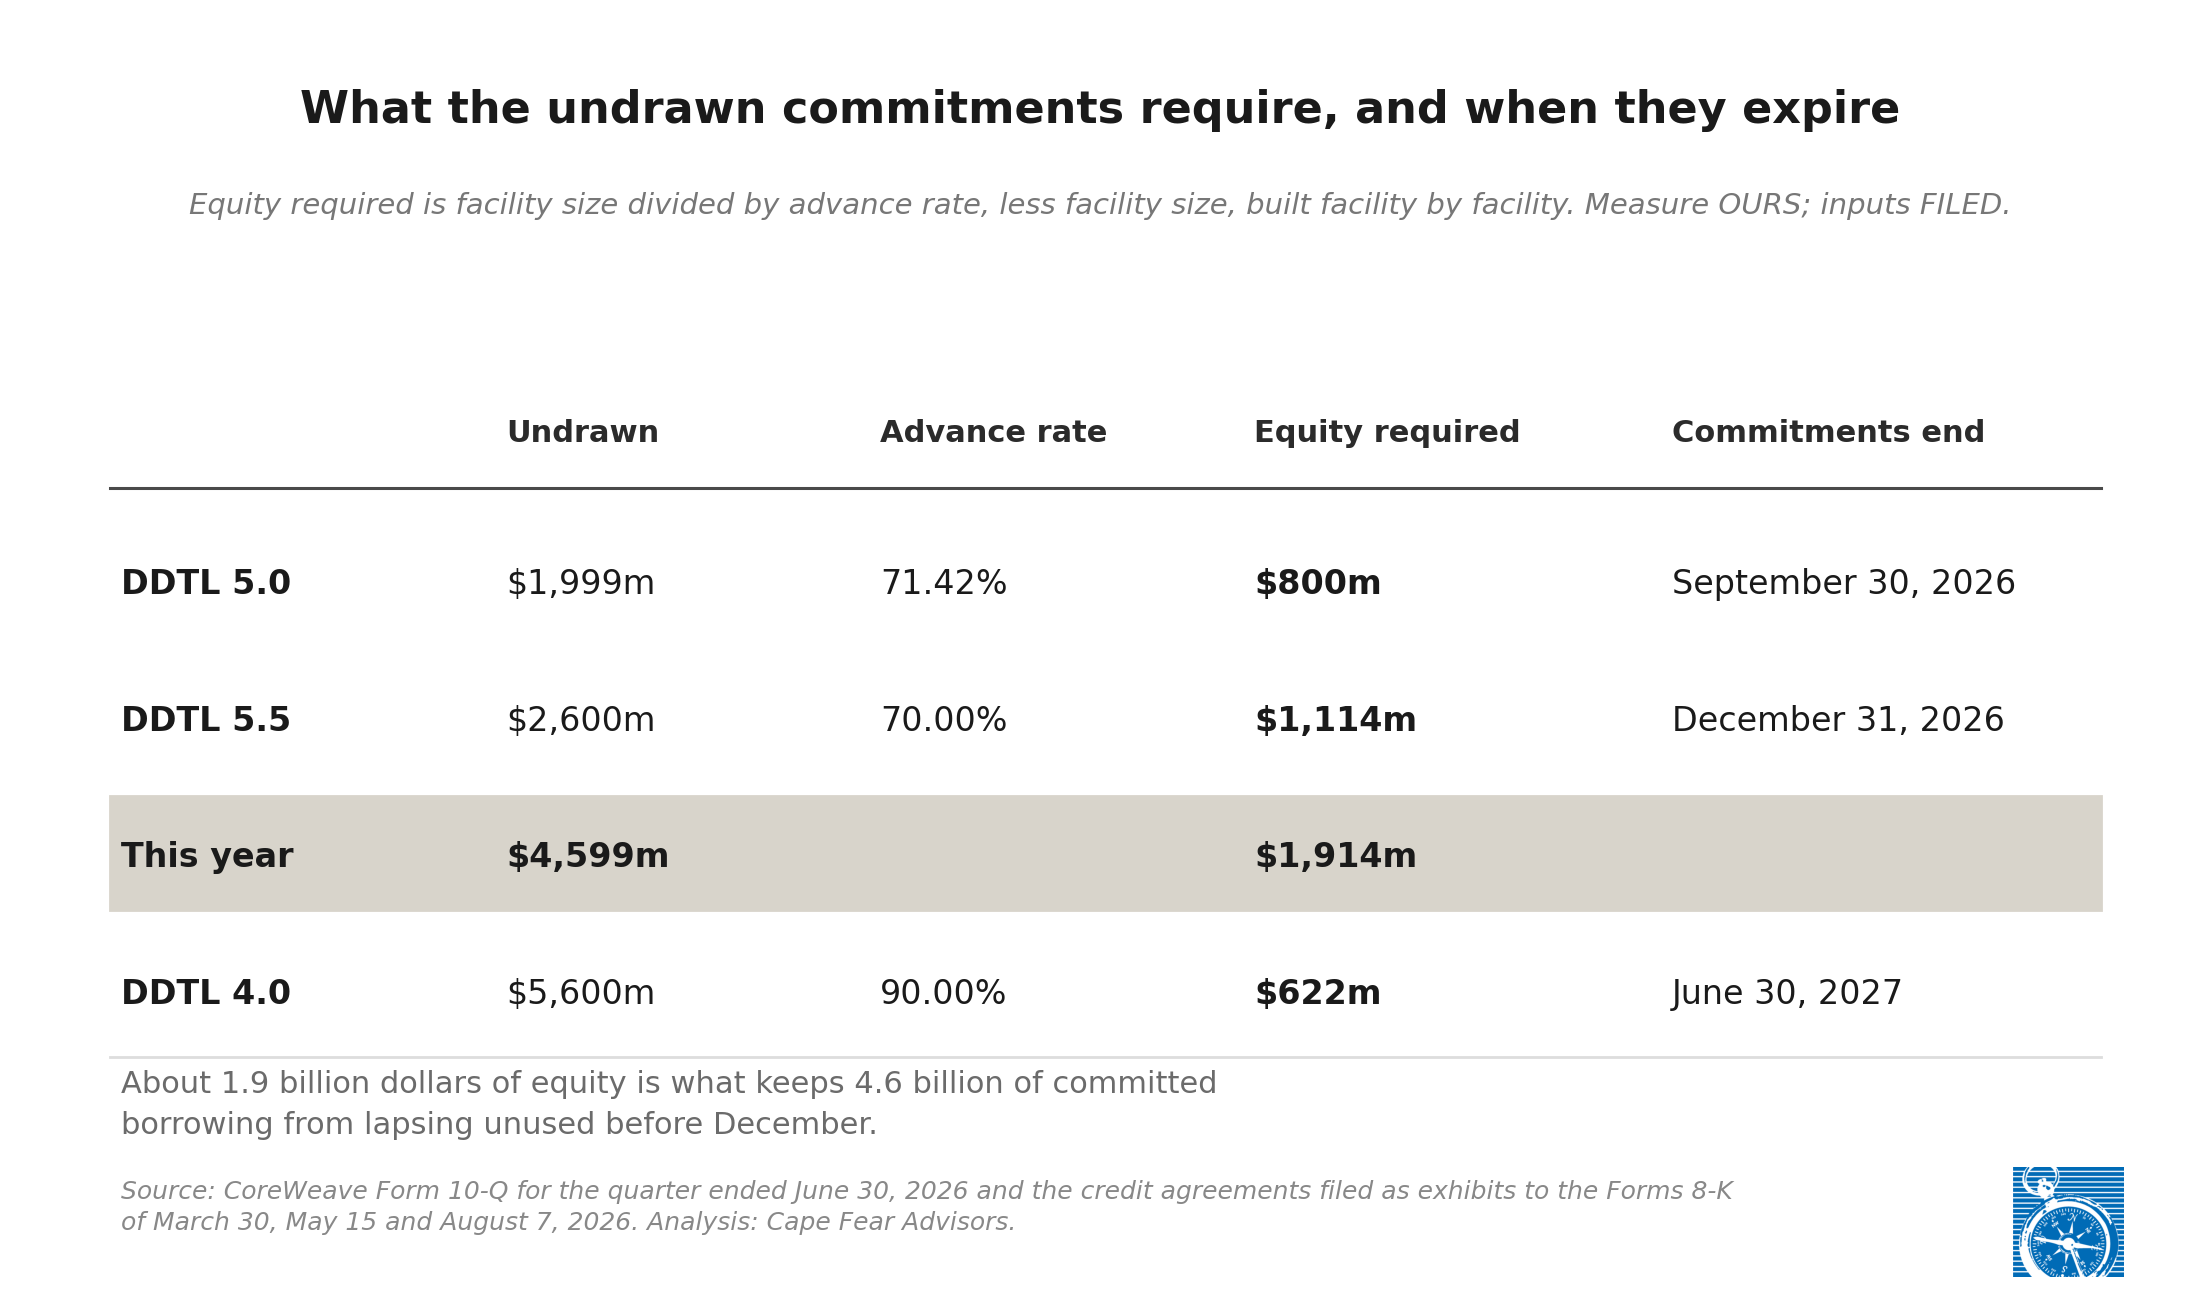
About $1.9bn of equity is what keeps $4.6bn of committed borrowing from lapsing unused before December. It is two thirds of one placement already completed.
The size of the ask
Guided capital expenditure for the second half is $20,883m to $24,883m. Scheduled debt principal is $4,413m. Cash and equivalents were $5,524m and availability under existing facilities was $10,014m at June 30, both filed, and the August facility adds $2,600m.
That $10,014m is a different quantity from the $10,199m above, and the two should not be read as one number. The filed figure is a June 30 measure of the revolver and the delayed draw facilities together, before the August facility existed: about $2,000m of revolver capacity, $5,600m undrawn on DDTL 4.0, $1,999m undrawn on DDTL 5.0, and a residual near $415m on older facilities the filing does not size separately. The $10,199m counts only the three facilities this piece follows, as they stand today, and leaves the revolver and that residual out.
Granting the company an operating cash conversion at least as favorable as the first half’s, and crediting every committed dollar as drawn, the committed resources fall short of December by $3.8bn to $7.8bn.
The equity slice is not added to that figure. Guided capital expenditure is the whole of the equipment purchase, and the slice sits inside it. What the slice constrains is the form of the money: at least $1,914m of whatever is raised has to be equity, because equity is what releases the commitments expiring September 30 and December 31.
Against 551,536,602 shares outstanding at July 31, and at the two prices this company has transacted at, the full gap is 35m to 71m shares at $109.00, which is 5.9 to 11.5 percent of the register, or 43m to 89m shares at $87.20, which is 7.3 to 13.9 percent. The $1,914m floor alone is 17.6m shares at $109.00, or 3.1 percent. The 2027 and 2028 programs are not guided and are not modeled here.
Where the lines point
The next entry does not have to be equity. What the record shows is four independent things pointing the same way, none of them requiring a forecast, and a set of alternatives that are open and priced.
The arithmetic. Equity in this structure answers to two calls. One is the slice each lender declines to advance. The other is the loss the operation runs.
Across the eighteen months from December 2024 to June 2026, the company spent $24,426m on capital expenditure and lost $2,533m, while paid-in capital rose $7,989m. Equity funded about three dollars in every ten of losses plus capital expenditure. The other seven came from debt, customer prepayments and vendor financing, each of which ranks ahead of the residual.
A shorter version of the same sum, for the first half alone, would need the advance rate on every facility drawn in the period. Three of those rates are filed and the older facilities’ are not, and a single blended rate misstates the answer for the reason set out above. So the eighteen-month share is the figure that travels.
The loan documents. All three agreements set a debt service coverage test at the borrower, first measured in November 2026, February 2027 and August 2027, and all three name a cure in Section 7.03. What differs is how many.
The March and May agreements name one, “the receipt of Equity Proceeds (which shall be in the form of common equity or other equity in a form reasonably acceptable to the Administrative Agent).” The phrase “Additional Master Services Agreement” appears nowhere in either document. The August agreement adds a second: “solely with respect to the financial covenant set forth in Section 6.12(a), the Borrower entering into an Additional Master Services Agreement (or renewing an existing Master Services Agreement) that satisfies the Eligibility Criteria,” at a projected coverage of 1.35 and a projected contract value ratio of 2.40.
So the newest and tightest facility is also the one whose covenant can be cured with a signature rather than with cash, and a miss is narrower in consequence than it first appears: Section 7.03(b) provides that the lenders “shall not be obligated to make any Credit Extension under any Facility” while a breach continues, which turns off the draws rather than accelerating the loans.
The covenant is therefore unlikely to be the binding constraint. On two of the three facilities, the only named way through it is equity.
The filings. An automatic shelf registration statement was filed June 5, 2026, and no prospectus supplement has followed it. We pulled the registrant’s complete 2026 filing index and filtered for every 424, S-1, S-3, 8-A and free writing prospectus form type; the shelf itself is the only result. The registered route to public equity has been in place for ten weeks and stands unused.
The history. Seven capital events in one hundred and ninety-six days, two of them equity, both in the first half of the sequence, and no equity since April 15.
None of that forecloses the other rungs. Prepayments, vendor financing and the unsecured market are all open, all took more money in the first half than they held at the start of it, and each is more expensive or more heavily occupied than it was. What the three facilities record is that the lenders now set the amount, the ratio and the price of the debt. Whatever those three leave uncovered has to come from somewhere the lenders do not price, and the list of those places is short.
What the capital already in has returned
That is what the next door costs. The other half of the question, and the one we came for, is what the doors already open have paid.
The two halves are one fact seen twice. A lender cutting its advance from ninety cents to seventy and a business failing to earn its cost of capital are both readings of capital intensity outrunning earning power. The lender is simply the first party in line to price it, and it prices in writing, on a date, in a filed exhibit.
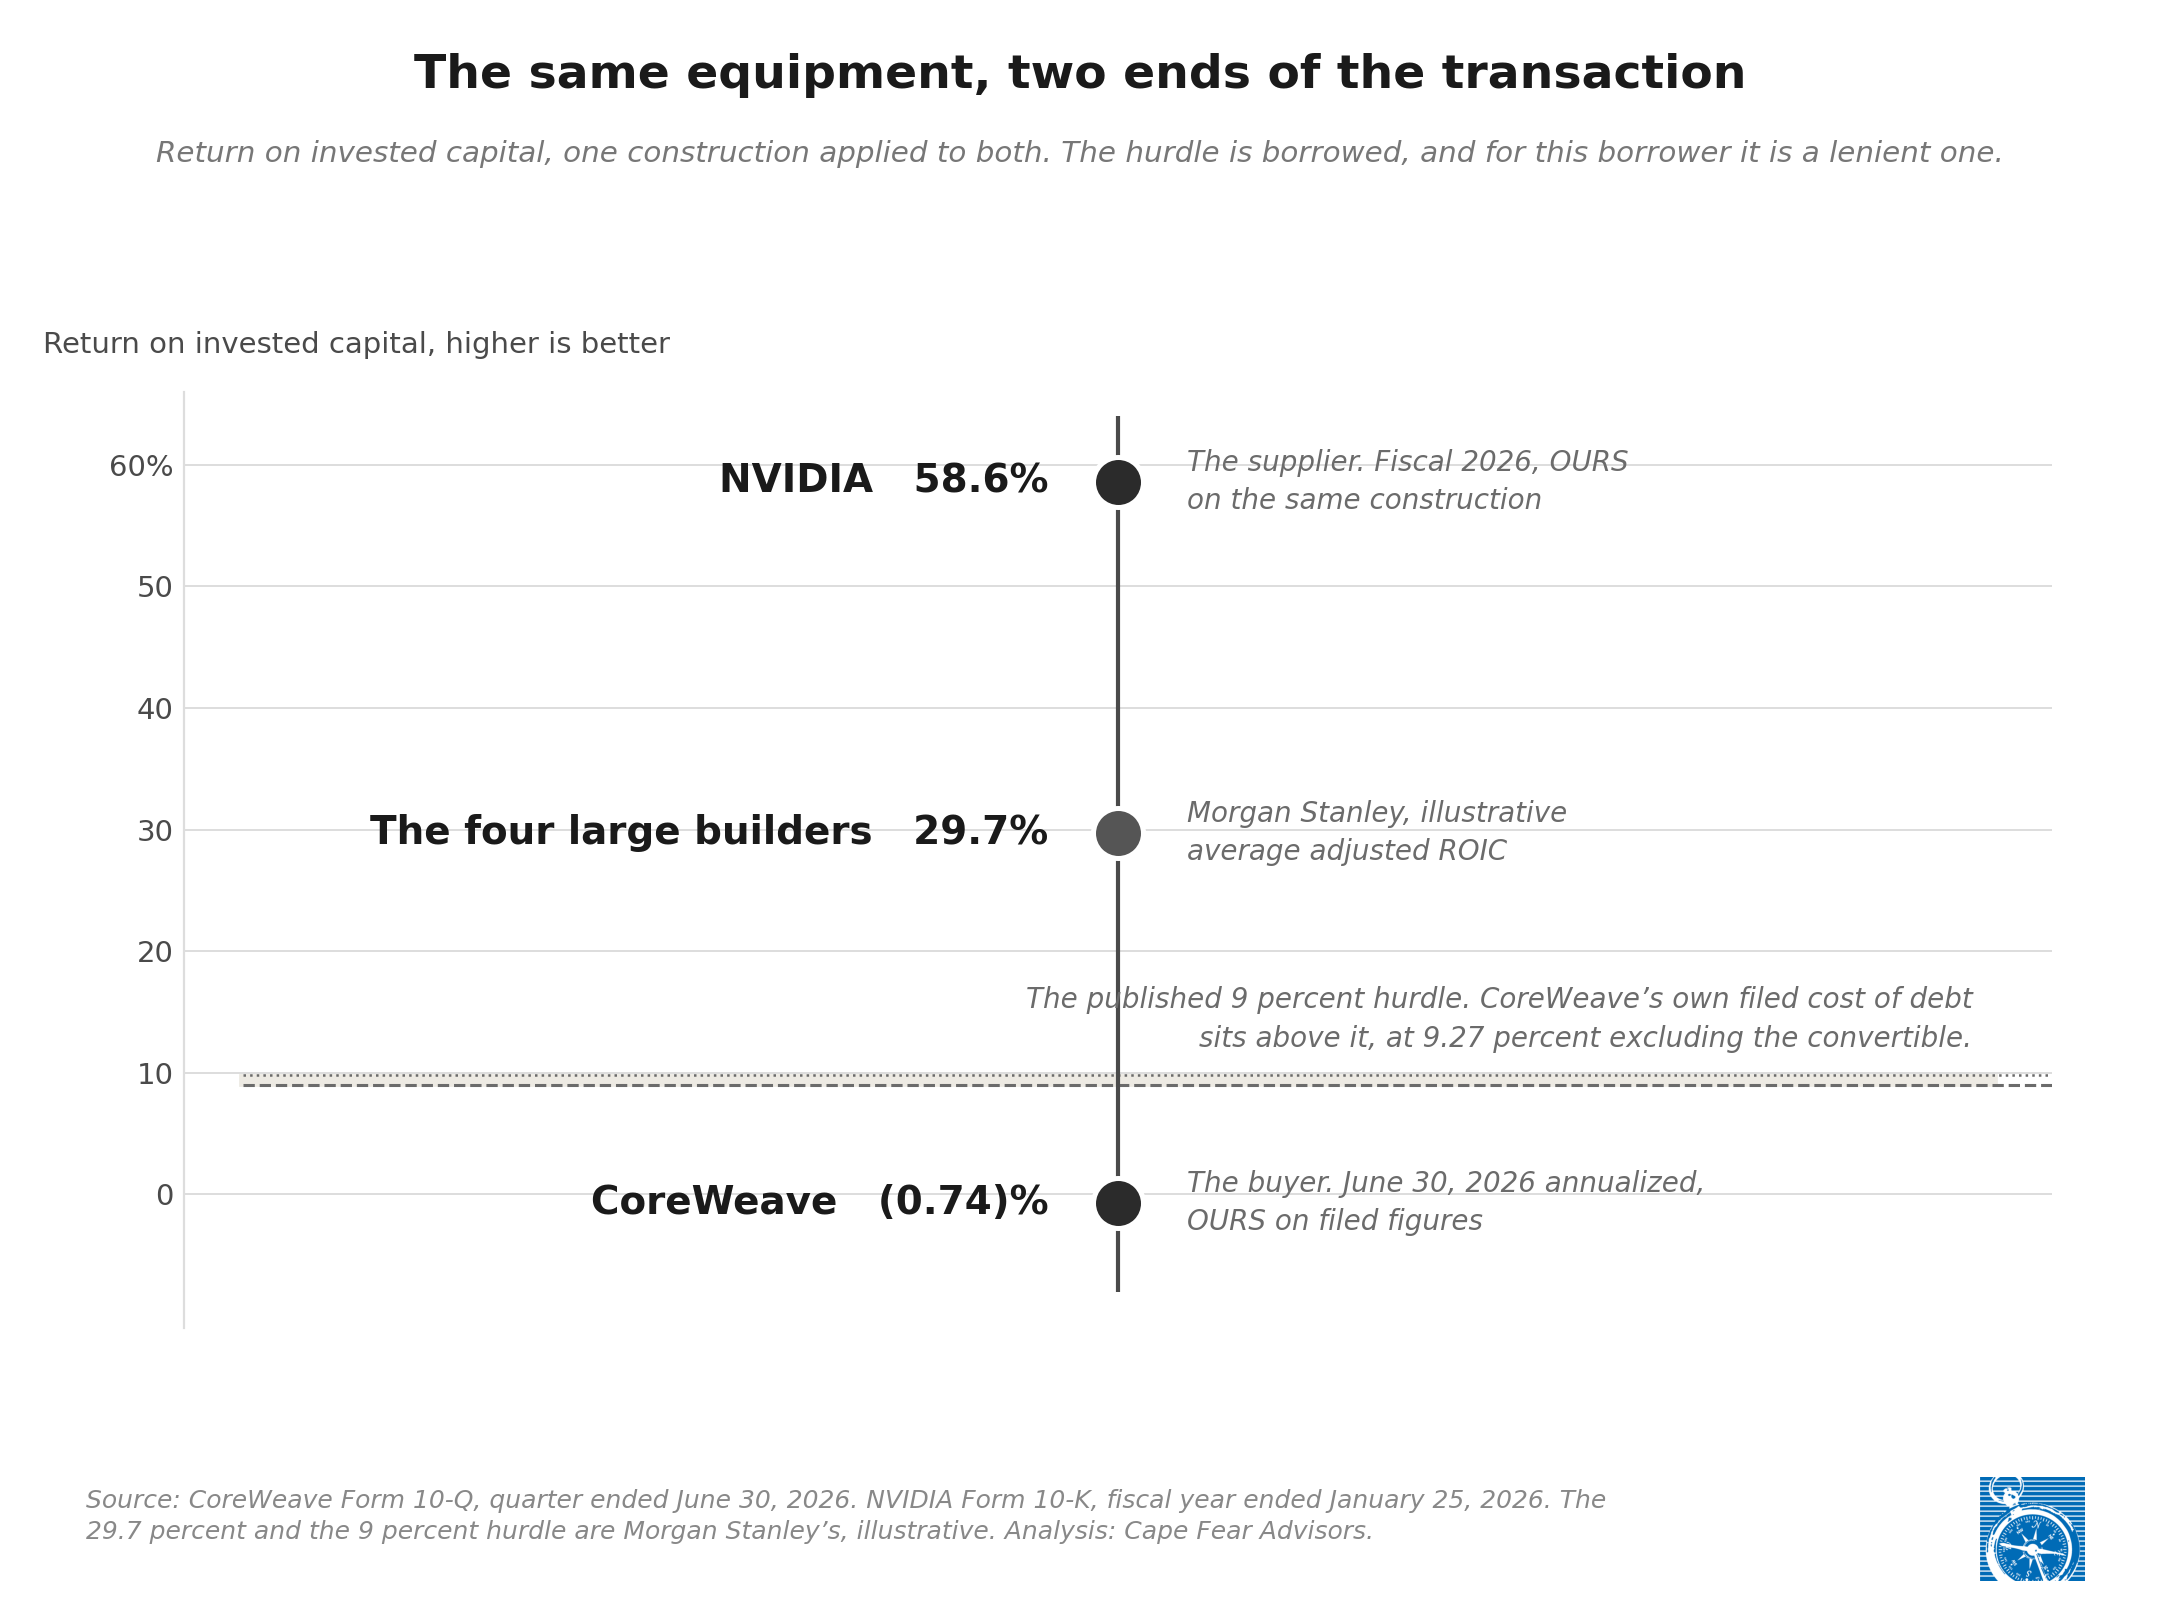
Last month Microsoft’s chief executive published an application scoring the four large builders on return on invested capital, built from a Morgan Stanley analysis by Brian Nowak: 29.7 percent average, four of four clearing a 9 percent hurdle, under the line “capital is visible, attribution is not.” That framework is built for companies whose AI spending is one line inside a much larger business, which is what makes the attribution problem the card names. We wanted to run the same style of arithmetic on a company where the buildout is essentially the whole balance sheet, and we wrote the test down in a working note on July 30, before CoreWeave’s second-quarter numbers existed, promising ourselves the result would print whichever way it came out. Here it is.
Invested capital is total assets less non-interest-bearing current liabilities, which is a standard construction and the one we used on the other companies in this comparison. Debt, finance leases and operating lease liabilities stay inside it, because they carry a cost. A second cut removes construction in progress, which is capital committed and not yet producing, and that cut runs in the company’s favor. Operating income is filed. The tax normalization is ours: 21 percent on profits, no benefit taken on losses.
One divergence from the July 30 note belongs here rather than in a footnote. That note specified a second cut we did not use, net property and equipment plus net working capital, which on the June 30 balance sheet gives $35,339m of invested capital and a return of negative 1.09 percent. It is the most adverse of the three constructions available, and the figures below use the one that favors the company.
What the capital base demands comes first, ahead of what it delivered, because the demand is the larger number and it needs no forecast at all. A return on invested capital is a margin multiplied by turns, and the turns are a June 30 fact.
At 0.178 turns of revenue per dollar of capital in service, clearing 9 percent requires an after-tax operating margin of 50.6 percent. On the second-quarter revenue rate annualized, turns are 0.197 and the requirement falls to 45.7 percent. The company’s own stated target, given on the first-quarter call, is a low double-digit adjusted operating margin by year end, on a measure that excludes stock compensation and intangible amortization and is stated before interest and tax.
Held the other way, on the June 30 base and with no further capital, clearing 9 percent at a 20 percent after-tax margin would take $23,553m of revenue, which is 2.29 times the second-quarter rate annualized. At a 15 percent margin it takes $31,403m, or 3.05 times.
A word about that 9 percent, because it is borrowed and it is doing a lot of work. It is Morgan Stanley’s, set for four investment-grade companies with very low costs of capital, and it appears here only because using one yardstick is what lets three different companies sit on one scale. For this company it is a lenient yardstick. CoreWeave’s own filed weighted cost of debt is 9.27 percent excluding the convertible notes, and the facility it signed in August prices near 9.8. The bar that matters to a CoreWeave shareholder sits above the line, not on it, which means every figure below is measured against a standard easier than the one the company pays.
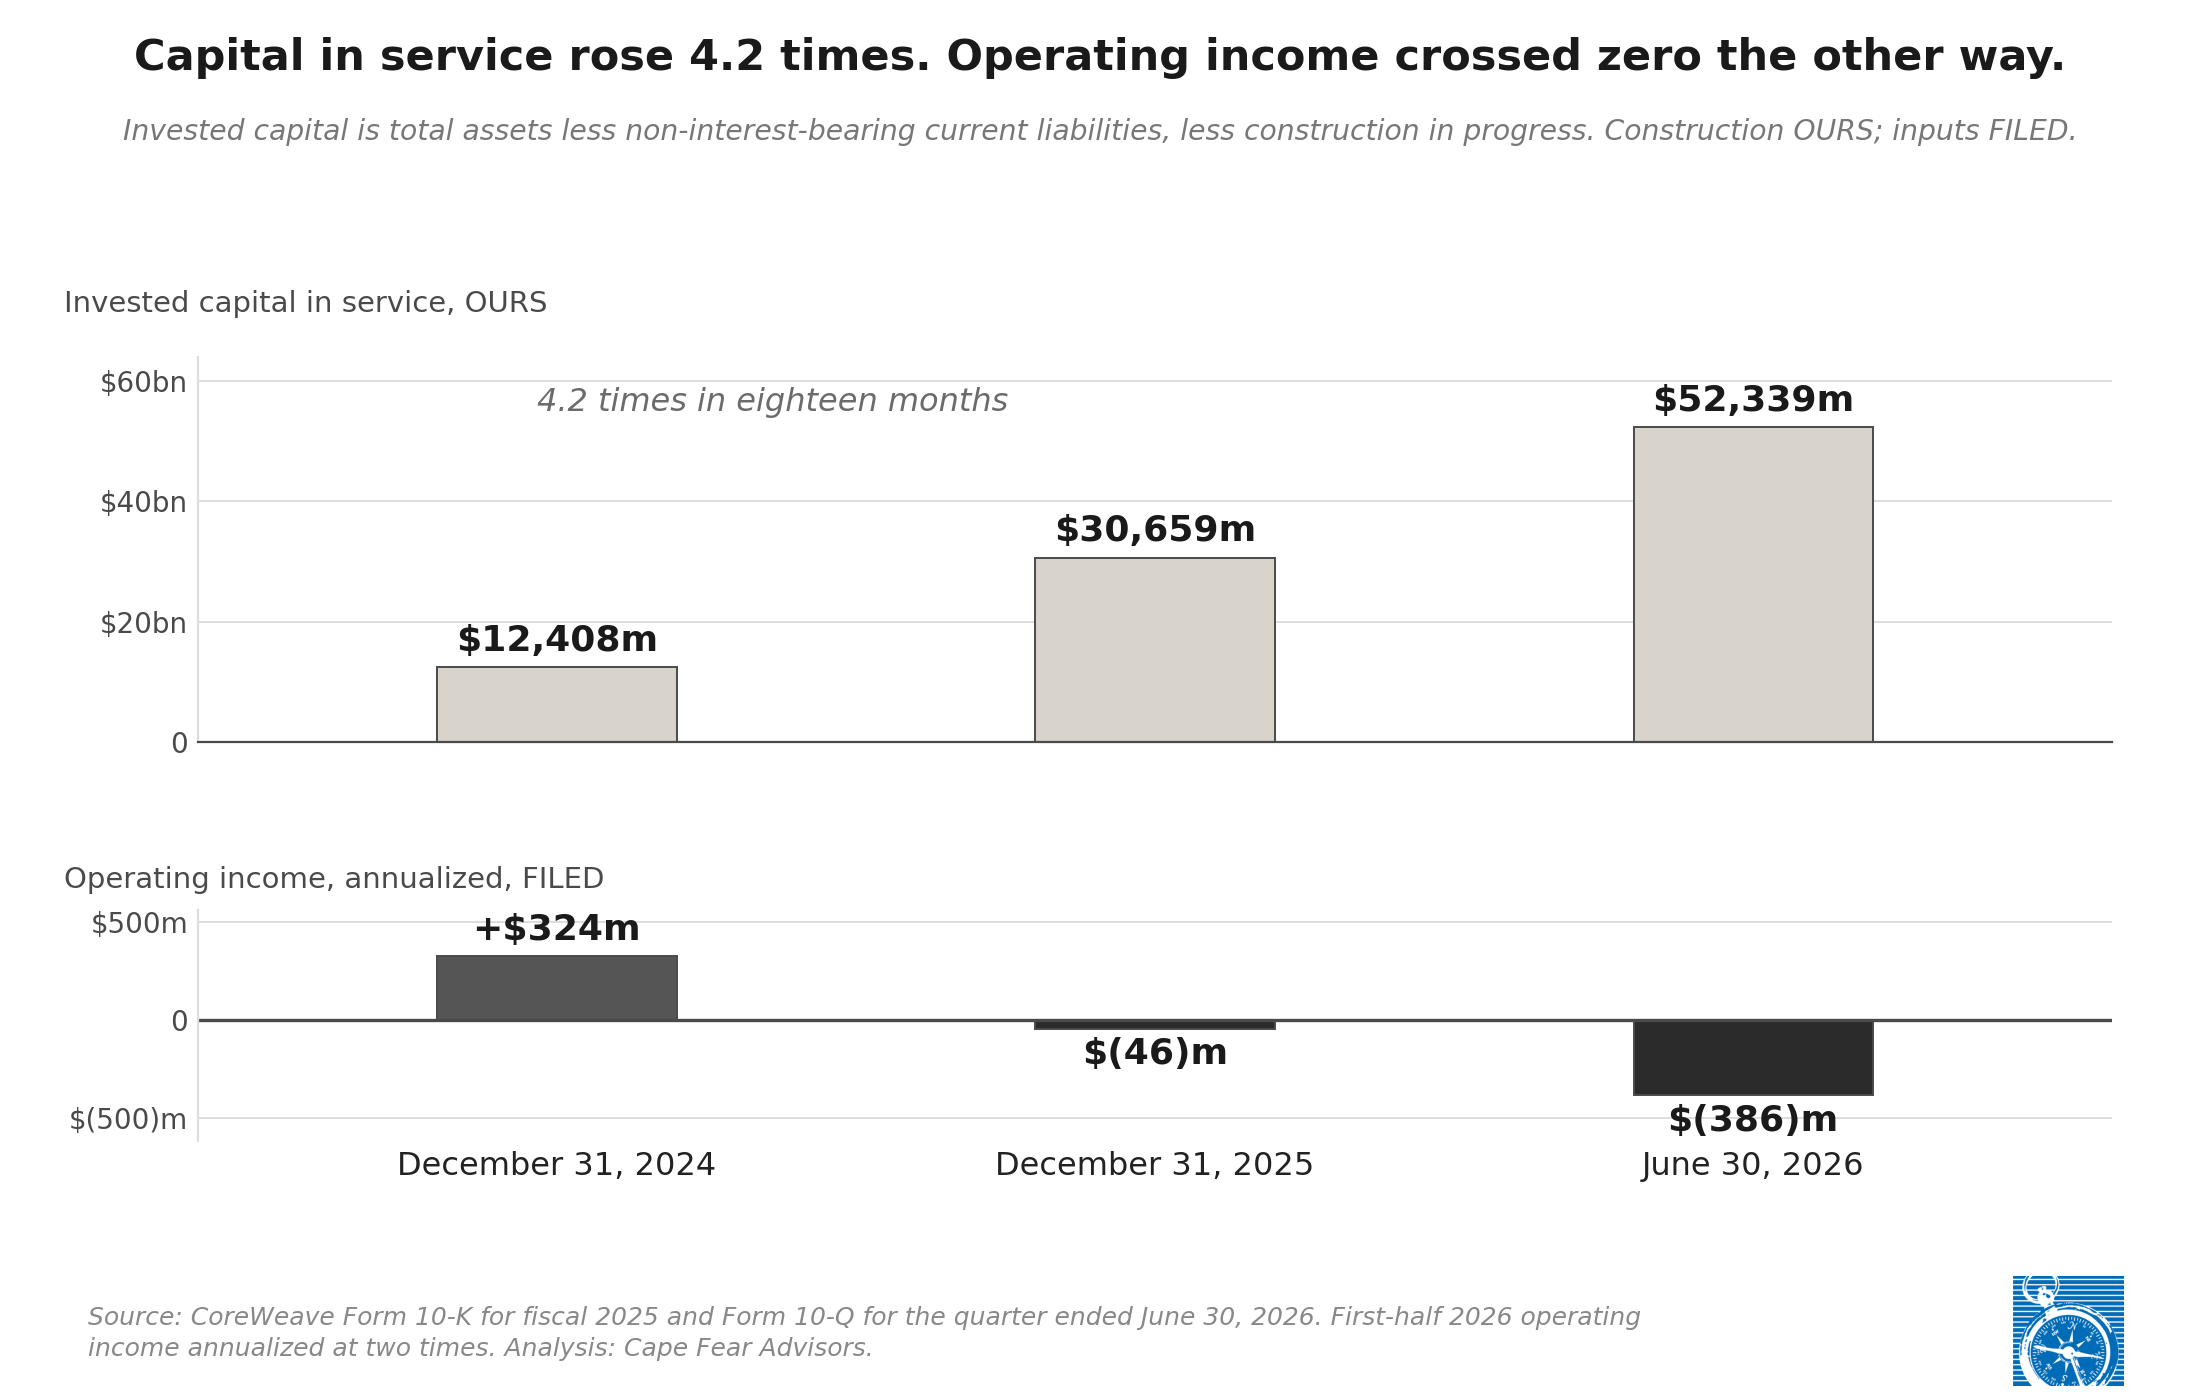
And the denominator keeps moving. Invested capital rose from $15,609m to $64,257m across those eighteen months, a factor of 4.12, while annualized operating income fell $710m and crossed from positive to negative on the way. Guided capital expenditure of $35bn to $39bn this year adds more, so the margin the business has to reach is a target that recedes while the argument about it continues.
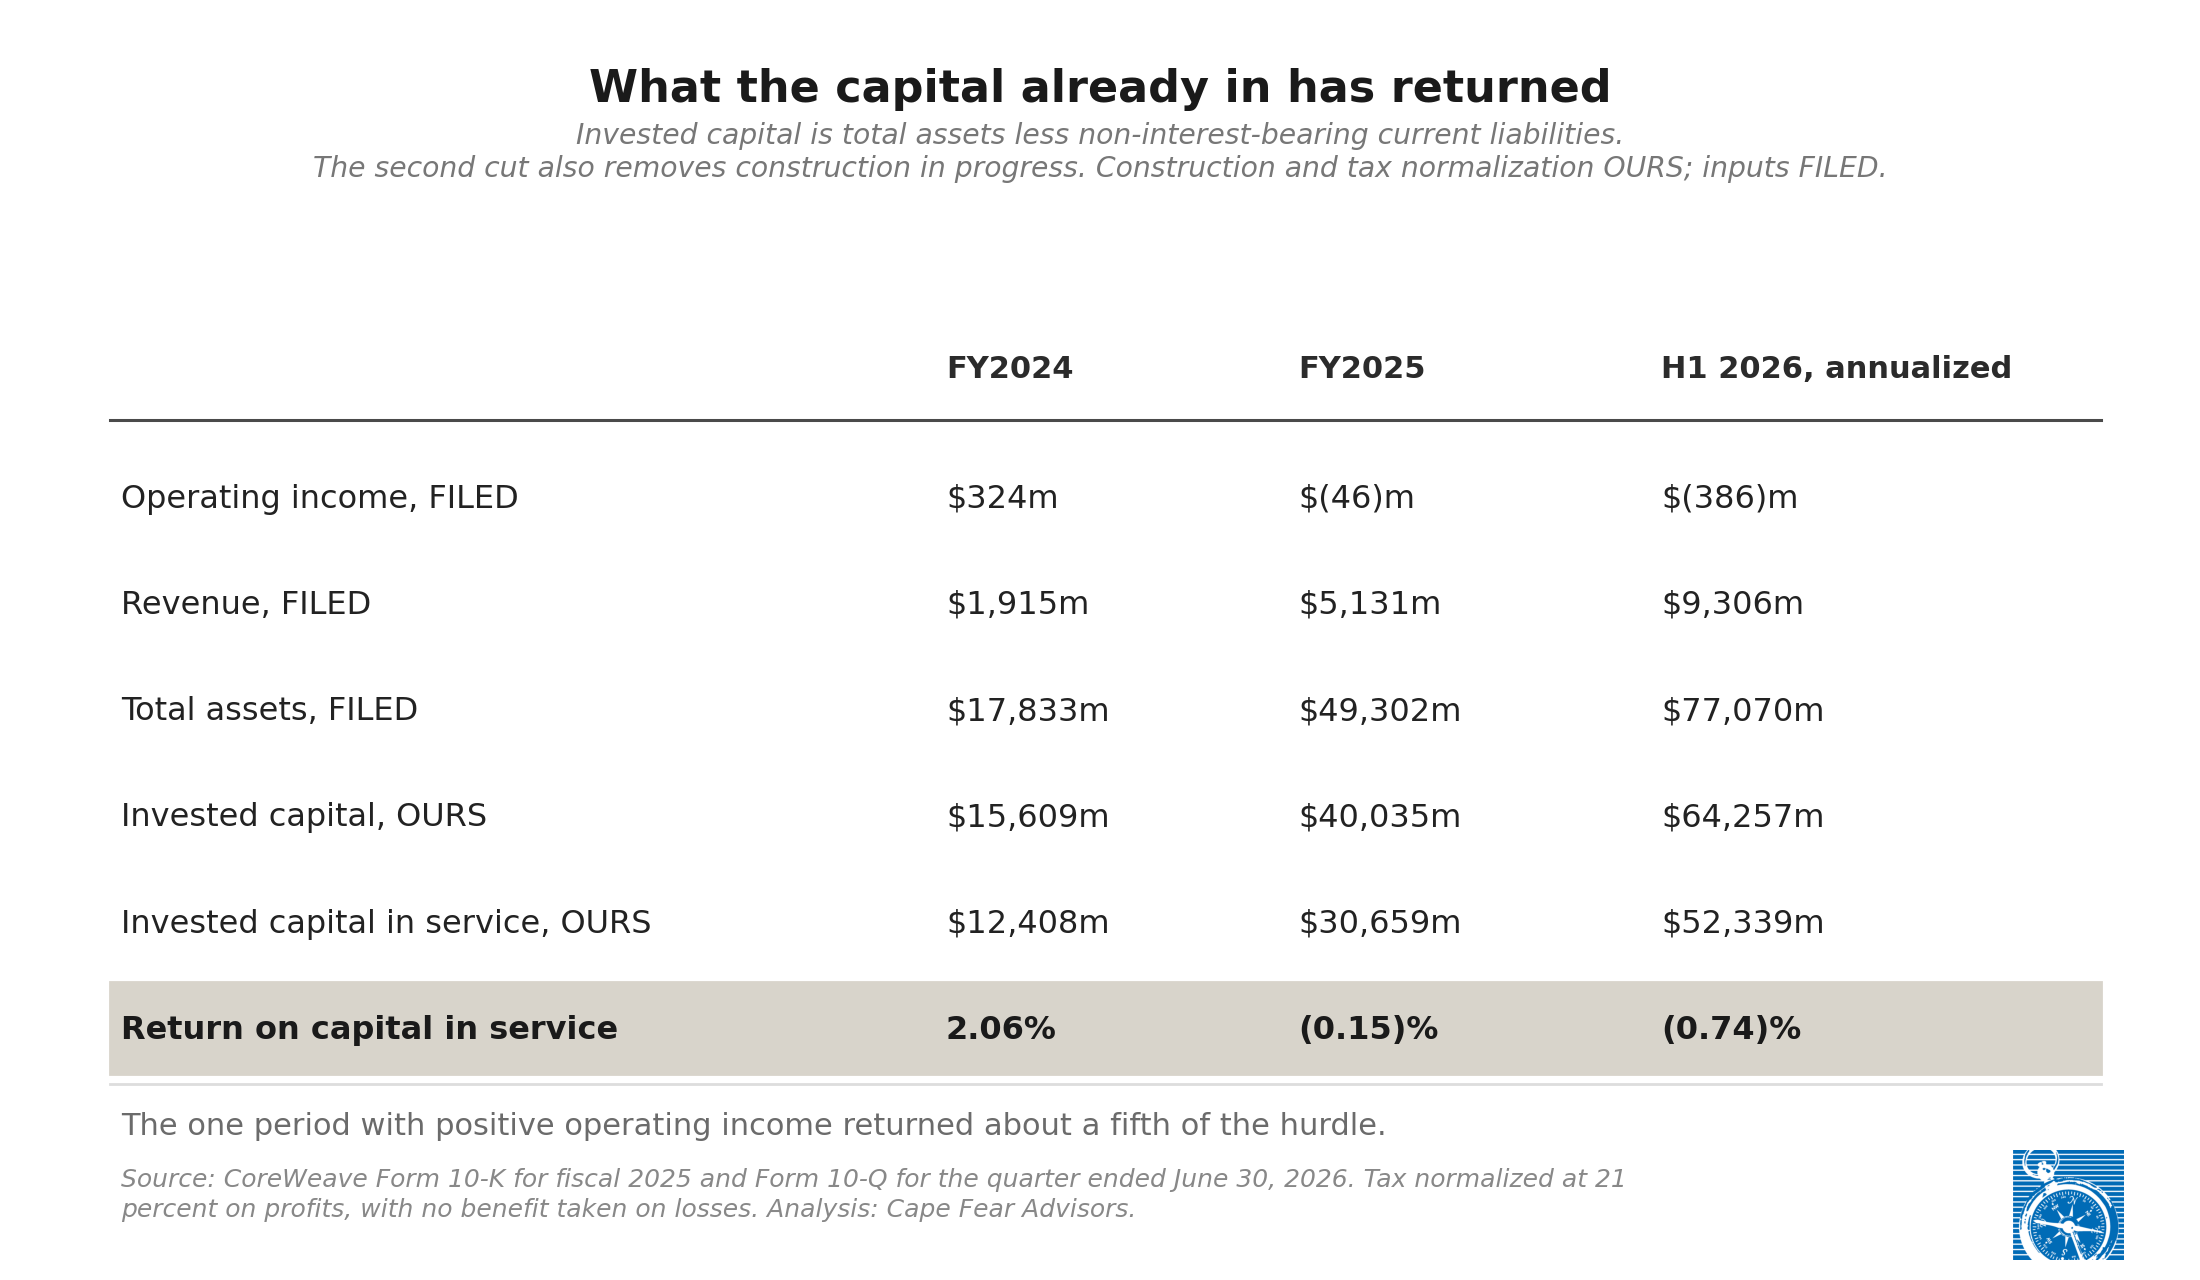
Against that, the level. Return on capital in service comes to 2.06 percent for 2024, negative 0.15 percent for 2025, and negative 0.74 percent for the first half of 2026 annualized. Taking a 21 percent benefit on the losses moves the last figure to negative 0.58 percent. Measuring pre-tax throughout moves 2024 to 2.61 percent. No convention available reaches 9 percent, and none reaches the company’s own filed cost of money, which is 6.34 percent weighted across the whole stack and 9.27 percent excluding the convertible notes.
The one period in the filed record with positive operating income returned about a fifth of the hurdle.
Revenue grew faster than capital, at 4.86 times, and that is the one line here that runs the company’s way. Capital turnover improved with it, from 0.154 to 0.167 to 0.178. The improvement is real. The level is the constraint.
Which is the point worth holding onto, because it disposes of the argument most often made on the other side. Demand is not the constraint. Remaining performance obligations grew 70.8 percent in the half, to $103.7bn, and revenue has run at 2.12 times year on year for four consecutive quarters. This company can sell what it builds. What the return calculation measures is something else: whether it can sell what it builds at a price that covers the capital required to build it. So far that answer sits below zero, and it sits below zero while demand is strong, which is the harder version of the finding.
What the arrangement costs to run
Arranging money costs money. The filings state the amount, and until now we had walked past it.
The debt note carries unamortized discount and issuance costs of $427m on recourse debt and $56m on non-recourse debt at June 30, against $242m and zero at December 31. The cash flow statement shows $86m amortized through income over the same half. So $327m of new debt friction was incurred inside six months, and $18m of issuance costs on the two equity placements sit beside it.
That is $345m of identified friction in six months, against $19,729m raised, or 1.75 percent of it. Carried against invested capital and annualized, it runs at 1.07 points a year.
So the hurdle is not 9 percent. It is about 10.1, and that is a floor, because arranger and agency fees sit in Fee Letters that the credit agreements reference and do not attach, and because the discount on the August facility falls in the third quarter.
Carried back into the return calculation, that friction lifts the required after-tax margin from 50.6 percent to 56.7. It is collected at close, whether or not the return arrives, and it recurs with each arrangement.
Two comparisons make the size legible. The $345m of six-month friction exceeds the $324m of operating income the company earned in its one profitable year. And on arithmetic we published earlier, a payback of 27 years at the spread we found, against a six-year depreciable life, means the equipment turns over about four and a half times inside one payback period. Each turn is financed, and each financing carries the friction again.
Who is on the other side
The first half of 2026 raised $3,073m of paid-in capital, of which $2,982m was two private placements.
NVIDIA bought $2,000m at $87.20 on January 23. NVIDIA supplies the equipment these facilities finance, holds a master services agreement as a customer, and was already a shareholder. Jane Street bought $1,000m at $109.00 on April 15, alongside a $6.0bn compute commitment announced with it. Jane Street is a customer and was already a shareholder.
Every dollar of equity raised in the half came from a counterparty that also transacts with the company commercially. Both were reported under Item 3.02 as unregistered sales. No motive is imputed and none is needed. The observation is about who was on the other side, and it is filed.
The record carries a third instrument of the same family, and the three are not alike.
In March 2025, on reported terms, OpenAI received $350.0m of stock in connection with a contract of up to $11.9bn, and no cash reached the company. In January and April of 2026, on filed terms, NVIDIA and Jane Street paid $2,000m and $1,000m for stock at $87.20 and $109.00, and the cash did reach it.
One issued stock and took no cash. Two sold stock and took cash at a price. One transaction of each kind establishes no rate for either.
The supplier is the load-bearing party
Of the counterparties on that list, one holds a position that the others do not, and following it changes how the whole arrangement reads.
The collateral under all three delayed draw facilities is equipment, and the definition each agreement uses to size a draw is the “Funding Date GPU Amount.” So the advance rate is a lender’s judgment about the equipment and about the borrower together, and the filings do not separate the two. What can be said without separating them is that the asset the lending market is pricing is the supplier’s product.
The plumbing runs the same way. Under the August agreement each draw request states the purchase orders it funds; where the borrower acquires servers from its parent, the lenders receive “a copy of each invoice from the Parent to the Borrower”; and within seven business days of a borrowing, proceeds may be distributed to pay those invoices. The parent sells the servers to its financing subsidiary, the lenders fund seventy cents of each invoice dollar, and the cash moves out to the supplier. That sequence is in Sections 2.03, 4.02 and 6.06 of the credit agreement.
Now the sizes. Technology equipment on this company’s balance sheet grew from $9,146m gross at December 2024 to $33,823m at June 2026, an increase of $24,677m. Over the same eighteen months the supplier bought $2,000m of stock. The supplier’s share of that equipment is not disclosed, and even so the order of magnitude is the finding: its commercial exposure to this company continuing is measured in tens of billions, and its equity exposure is two.
That is the asymmetry, and it is the reason the arrangement holds. An equity holder is paid out of the residual, last, if anything is left. A supplier is paid on delivery, at its own margin, and keeps the stock besides. The supplier’s reason for wanting this company to keep buying sits on the supplier’s income statement, not on this one, and it has very little to do with what the residual is worth.
Which is also why the return calculation above is only half the picture. Run the same arithmetic on the supplier and it comes out at 58.6 percent on its fiscal 2026, against negative 0.74 here.
The rest of the ladder
Every other source of money is open. Each also has a ceiling, and the filings describe where it sits.
The starting condition is the company’s own: an operating loss of $193m and a net loss of $1,366m for the half, and “We have generated significant losses from operations, as reflected in our accumulated deficit of $4.0 billion as of June 30, 2026.”
Working capital supplied 40 percent of the half’s operating cash, and 92 percent of that came from customer prepayments. Payables and accrued liabilities rose $2,661m on the balance sheet but contributed only $304m to operating cash, because the rest belongs to the equipment program: accrued purchases of $5,520m, accrued interest of $410m, other of $494m. This rung grows with the buildout rather than independently of it, and its operating elasticity ran about $300m in a half whose program exceeded $20bn.
Customer advances are the rung with no coupon, and they are also a claim. Deferred revenue grew $1,507m on the balance sheet and the cash flow statement credits $1,365m of it. Cash of $5,524m stands against $9,692m of deferred revenue, so the company holds 57 cents for every dollar of compute paid for and not delivered, and each further dollar enlarges an unsecured claim ranking ahead of the residual. Olga Usvyatsky of Deep Quarry and Francine McKenna of The Dig traced the $1.3bn reclassification inside that arc in a joint piece on August 15, and readers who want that question should go to them for it.[1]
Collateral is largely committed. About $21.5bn of assets sit inside the special-purpose structures, against property and equipment of $46,736m, and the filing does not characterize the remainder. A sale of collateral is a mandatory prepayment event, so a sale from inside pays the lenders first.
The other debt rungs are open and priced. The revolver carries $2.0bn of remaining capacity with $533m of letters of credit reducing availability, at a quarter point on the undrawn part, and those letters are issued “primarily in support of certain lease obligations,” which puts bank credit behind the landlords. OEM and vendor financing stands at $5,102m, up $937m in the half. Four note issues cleared in the half at 9.27 percent weighted, excluding the convertibles.
A fourth delayed draw facility is possible; three cleared in five months and nothing in the record says a fourth could not. A fourth on August’s terms at August’s size would require $1,114m of equity before a dollar of it could be drawn. This rung cannot open itself.
Why it continues, and rationally
None of the above forecasts an ending, and the arithmetic of the half runs the other way. This is the part of the story a bear tends to skip, so it is worth giving in full.
The accumulated deficit grew $1,366m in the first half while paid-in capital grew $3,073m, so the corpus was refilled at 2.25 times the rate it was drawn. Book equity rose from $3,335m to $5,024m even as the deficit rose. Book equity per share rose from $6.64 to $9.12, up 37.2 percent, because the placements were struck at roughly nine times book, and selling equity above book raises book per share for the holders who stay. That is a standard result and it holds here.
The clock on the residual does not start until issuance stops, and issuance in every form has continued. What the residual holds against all of that is the ninth position of nine, behind a $1,300m repayment gate.
What this says
We came to this company to understand the pure-play neocloud and its place in the financing chain that the large builders sit at the other end of. That question has an answer now, and the answer is not that the arithmetic fails to add up. It is that the arithmetic which decides this arrangement is computed on other balance sheets.
Measured here, the capital in service returned negative 0.74 percent annualized in the most recent half, against a filed cost of debt of 9.27 percent excluding the convertible. The friction of arranging the money lifts the hurdle above 10 percent before the first dollar of return. The denominator grew 4.12 times in eighteen months and the numerator went the other way. Forty-four cents of every dollar ever contributed to this company has been consumed, and that fraction did not move across a half in which $3,073m of paid-in capital and $26,079m of liabilities arrived.
Measured elsewhere, each participant’s own trade closes. The lender holds a 70 percent advance rate against contracted equipment at SOFR plus 550, senior, secured, dated. The arranger was paid at close. The customer prepays and ranks ahead of the residual.
And the supplier, which is the party that matters most, was paid on delivery at its own margin and kept the stock besides. On the same construction used here, it earned 58.6 percent on its invested capital last fiscal year. Its commercial exposure to this company continuing is measured in tens of billions of equipment; its equity exposure is two. Whatever reason it has for wanting the buying to continue, that reason is computed on its income statement, and the value of this company’s residual has very little to do with it.
Every one of those counterparties gave consideration and every one of them was paid. None of their returns requires this entity to clear a 9 percent hurdle, and none of them is computed on this entity’s income statement.
Which puts the position plainly. This company sits in the middle of the chain, by position and by choice, and across every period measured here it has not earned a return above the cost of the capital it commits. The party on one side of it earned 58.6 percent on the same construction. The party on the other side cannot be measured from outside, and we would rather say so than guess. They are not victims of the arrangement, since they signed every agreement described here. On this evidence they are also not the ones collecting from it.
So the corpus holds value to the participants independently of its own return. That is the mechanism, and its four parameters are now on the record: the advance rate that releases the debt, the slice of equity that releases the advance, the friction taken at close, and the coverage calendar that dates the next tests. Those four are what we came looking for, and the circular financing we came asking about turns out to be the thing holding all four in place.
We could not construct a version of this business that works without the circle. We offer that as a limit on our own imagination as much as a finding about the company, and we would rather be shown wrong than be right about it.
None of it stops the entity from continuing, and the rationale for continuing is solid. Every rung of the ladder is open and each is more expensive than it was, which describes a cost rather than a wall.
What the record does say plainly is that the price of continuing is paid in a currency the residual holder supplies: equity that releases debt, friction collected at close, and a return that has not yet appeared on capital that quadrupled.
The larger arithmetic sits one level out, with the participants whose round trips do close, and that is where we go next.
What it does not say
It does not forecast a default, a missed covenant, or a failure to raise. This company has raised capital every two to three months for two years and the record says it can.
It names nobody as the writer of the next check.
It imputes no motive, and every arrangement described here is stated as an effect rather than as a design. Every counterparty named gave consideration for what it received.
And it does not claim the return calculation is the company’s own. The filings do not compute a return on invested capital. The construction is ours, the inputs are filed, and both are printed above so the arithmetic can be disagreed with on its own terms.
How this could be wrong, and why the list is short
We usually close with a falsification block. Most of what would normally go in one belongs elsewhere here, and the reason is a method point worth stating.
The return, the friction and the counterparty findings measure periods that have closed. A restructuring charge, a sale of the company, an amendment, a wind-down, or a decade of better returns would each change what happens next without changing what happened. An event after the measurement date is not a falsifier of the measurement. What can falsify a measurement is a restatement, a construction objection, or an arithmetic error, and those are the three that follow.
A restatement of any filed input moves the result. The 2026 figures are unaudited, and the round trip in the contract balances meets its first audit at the fiscal-year 10-K.
The invested capital construction is ours, and it is the place to attack the return. Three cuts are shown, including the most adverse, from the July 30 note. A reader who would cut differently should name which assets and rerun it. On the in-service cut, the hurdle needs an after-tax margin near 46 percent at the second-quarter revenue rate, and any construction that brings that requirement into reach falsifies the section.
One claim here is prospective and it carries the ordinary falsifiers. The gap arithmetic is a statement about the next four months. It is wrong if the capital program is slowed to match available cash, which the company controls and which its liquidity representation is written to accommodate. It is wrong if a facility clears at a higher advance rate than the last three. And it is wrong if an investment-grade customer pays a large advance without stock attached, or if a registered takedown places equity with buyers who have no commercial relationship with the company.
What is not disclosed
Current commitments for capital expenditure, the single number that reconciles the liquidity representation to the guidance.
Arranger, agency and rating agency fees, which sit in Fee Letters referenced in the agreements and filed nowhere, and which would convert the friction floor into a total.
The size of the variable consideration deduction taken against remaining performance obligations. The company names its components as “estimates of future potential credits to customers under availability of service agreements, amounts that may not be recognized as revenue due to delivery delays, and estimates of committed cloud computing capacity that the Company has the right to resell,” and sizes none of them, while the risk factors record a realized instance of “insufficient power to service a customer’s project” that required service credits.
That last item is the most interesting number left on this company, and the reason it is interesting is not ours. Olga Usvyatsky and Francine McKenna have the dated chronology around the variable consideration language, when it left the filings and when it came back, which is reporting the documents alone will not give anyone. Their thread and this one meet there, on the one figure neither of us can size.[1]
The split of cost of revenue between rent, metered power, personnel and power-plant depreciation.
The amortization schedules at each special purpose borrower, which set the coverage-test denominator.
Whether property and equipment outside the special-purpose structures is encumbered.
The identity of the single customer contract behind DDTL 4.0.
Notes
[1] Olga Usvyatsky and Francine McKenna, “What CoreWeave’s $1.3 Billion deferred revenue reclassification might be telling us,” Deep Quarry, August 15, 2026. Deep Quarry is Olga Usvyatsky’s publication and The Dig is Francine McKenna’s; the piece ran jointly on the former.
Corrections and provenance, August 16, 2026. One correction to our own published work. The DDTL 5.5 ledger of August 14, 2026 described that facility’s cure right as taking only equity. Section 7.03 of the August agreement names a second cure, a qualifying new or renewed Master Services Agreement, and the published sentence was incomplete. Re-reading the March and May agreements for this piece establishes the fuller picture: those two name the equity cure alone, and the phrase “Additional Master Services Agreement” appears in neither. The correction runs against our own earlier reading and is stated here rather than left to a footnote.
Two further items are stated because a reader checking the filings will meet them. The April 14, 2026 Form 8-K reports “$1,750,000 aggregate principal amount” of 9.750% Senior Notes due 2031 while the June 30 balance sheet carries that line at $2,750m, and the same 8-K writes the convertible notes as “$4,000,000,000”; the balance-sheet figure is used here. And the revolving credit facility reconciles across both dates to a commitment near $2.5bn: December carried $1,000m drawn, $294m of letters of credit and $1.2bn remaining, and June carried none drawn, $533m of letters of credit and $2.0bn remaining.
Method. FILED figures come from the Form 10-Q for the quarter ended June 30, 2026, accession 0001769628-26-000366, the Form 10-K for fiscal 2025, accession 0001769628-26-000104, the Form 8-K filings cited by accession, or the credit agreements filed as exhibits to them: DDTL 4.0 at Exhibit 10.1.1 to accession 0001769628-26-000129, DDTL 5.0 at Exhibit 10.1 to accession 0001769628-26-000236, and DDTL 5.5 at Exhibit 10.1 to accession 0001769628-26-000357. GUIDED figures come from the August 11, 2026 earnings materials. REPORTED figures come from third-party or company publication and are labeled where used. NVIDIA figures come from its Form 10-K for the fiscal year ended January 25, 2026, on the same invested capital construction and the same tax normalization. The second cut, which removes construction in progress, is applied to CoreWeave and not to NVIDIA; applying it to NVIDIA would raise NVIDIA’s figure, so the comparison as drawn understates the distance between them. Everything else is OURS, including the coverage ratio, the ladder, the equity slice arithmetic, the invested capital construction, the tax normalization and every return figure, for both companies. The 9 percent hurdle and the 29.7 percent comparison are Morgan Stanley’s, per Brian Nowak’s analysis as rendered in the application published by Microsoft’s chief executive on July 30, 2026, and described there as illustrative.
Standing disclosure: Cape Fear Advisors holds no direct position, long or short, in CoreWeave or in any company named here; any exposure is indirect, through managed funds it does not control, which may now include index funds holding the public companies named. Anthropic is the developer of Claude, which is used in preparing this research. That nearness cannot be checked away, which is why no claim here rests on trust in the tool: every figure carries a public source, and the record grades the rest. Others named in this piece have ties to the filer: NVIDIA supplies the equipment the facilities finance, is a customer, is a shareholder, and is measured here on the same construction as the filer; Jane Street is a customer and a shareholder; OpenAI is a customer that received stock; JPMorgan and MUFG are arrangers and JPMorgan is administrative agent on the August facility, with Morgan Stanley holding those seats on the May facility and publishing the return framework cited here; Microsoft is a customer of the filer and published the application that framework appears in. Companies not named here may hold positions or supply relationships that bear on the filers discussed, and that possibility is part of why every piece is re-checked for bias, ground facts, and filings rather than read against a fixed list. Figures are quoted from the filers without characterization, and the same standard of reading is applied to every filer named.
Analysis: Cape Fear Advisors. Not investment advice.
This piece also appears on Substack. Cape Fear Advisors is an independent advisory firm based in Portsmouth, NH.
Contact Cape Fear Advisors