


"There is something fascinating about science. One gets such wholesale returns of conjecture out of such a trifling investment of fact."
Mark Twain, Life on the Mississippi, 1883, chapter 17, on extending 176 years of the river's shortening a million years back and seven centuries forward.
Anthropic's registration statement describes a business that went from $197 million of quarterly revenue to about $16.9 billion in seven quarters, and it reads like a first draft: the third quarter is a ratio and the contractual obligations table is blank down to its date. The price, a reported $2 trillion, asks for two things the filing cannot yet show: where revenue starts, and how fast it grows from there. Every growth rate we measured from the filing puts next year's revenue at $193 billion or more; the third quarter's slowdown carried forward, our own construction and below all of them, puts it at about $82 billion. The trillion-dollar club's record puts the decade after that anywhere from Microsoft's pace to Amazon's. Together they spread revenue ten years out by a factor of five. At that price, a buyer needs a big next year, or the club's best decade after a slowdown, just to match a Treasury. Two more quarters would show where revenue starts; only years will show the rest. We call the distance between what the price requires and what the record can show the growth gap. (1)
A growth IPO, six quarters in
Our first read, on October 26, the day the S-1 went public, found the revenue reported gross, with the fees the cloud marketplaces keep booked as an expense, and the third quarter stated only as a ratio. It also found the revenue added rising every filed quarter, to $6.8 billion in the second quarter of 2026. On the ratio, the third quarter added about $5.4 billion, the first quarter on the record to add less than the one before. (2)
Every figure below comes from one line of arithmetic: revenue at the start, compounded at a growth rate for ten years, priced at a multiple and set against $2 trillion. The filing gives the start softly and the rate hardly at all, and the reading turns on two points. On the history, six quarters cannot yet say whether next year brings about $82 billion or $193 billion and up, and every comparable's growth readings had settled by this stage. On the return, the question is narrower than whether Anthropic succeeds: on the slowdown path, even the best decade on record pays a buyer at $2 trillion 6.4% to 8.8% a year for a venture's risk, while the holders who took that risk before the history existed are carried at about 17.5 times their money.
The cover carries the legend every preliminary prospectus carries, "Subject To Completion," with the date beside it blank. The figures inside are stated without adjectives. The company launched Claude in the first quarter of 2023. Quarterly revenue went from $197 million at the end of 2024 to $11.6 billion in the second quarter of 2026, and headcount grew more than five times over the same span. Models released in the six months to September 30 earned over 80% of third-quarter revenue. The risk section runs to 94 pages.
The filing reaches in one place, the size of its market. "We believe the work that knowledge workers perform represented more than $40 trillion in economic value globally in 2025," the S-1 says, and its own method note defines that figure as "global knowledge workers' wages." A standard prospectus sizes a market in steps: total, serviceable, obtainable. This one states a single gross figure and the potential "to make them meaningfully more productive." (3)
The S-1 states that third-quarter revenue "was 86 times our revenue for the three months ended December 31, 2024," which puts it at about $16.9 billion. Annualized, that is about $67.8 billion, the base for everything that follows. It is our measure: the S-1 defines its own Run-Rate Revenue (28 days of usage times 13, plus subscriptions times 12), and that figure is due in the amendment. Reuters reported third-quarter revenue of $16.8 billion on October 15, consistent with the ratio. (4)
The price is reported, and Anthropic has set none. The Financial Times reported in August that the company could seek "at least $2 trillion." Reuters reported on October 15 that attendees at an investor meeting "discussed a valuation of around $1.5 trillion," and that some "expressed disappointment with the slowing sequential growth rate," so the offering has had its first feedback. The Wall Street Journal put the range at $1.5 trillion to $2 trillion on October 26. We run every exhibit at $2 trillion, the top of the talk, and state the $1.5 trillion figure beside it. (5)
The governance takes one sentence. Class F common stock holds a fixed 50.1% of the vote, so any return to a new holder of Class A comes at the controllers' discretion, as at every dual-class listing we have read. (6)
How much of the price is growth
By the trillion-dollar club we mean the eight American technology companies that have passed $1 trillion: Alphabet, Amazon, Apple, Broadcom, Meta, Microsoft, NVIDIA and Tesla. Six listed recently enough for their prospectuses to sit on EDGAR, and those six are the comparison here. The first measure asks of each: how much of the price at IPO was already in revenue? We take the last reported quarter before listing, annualize it, and price it at what Alphabet and Meta traded for on October 26, 8.36 and 6.66 times revenue. Whatever the IPO price exceeds that by is growth the buyer paid for in advance. (7)
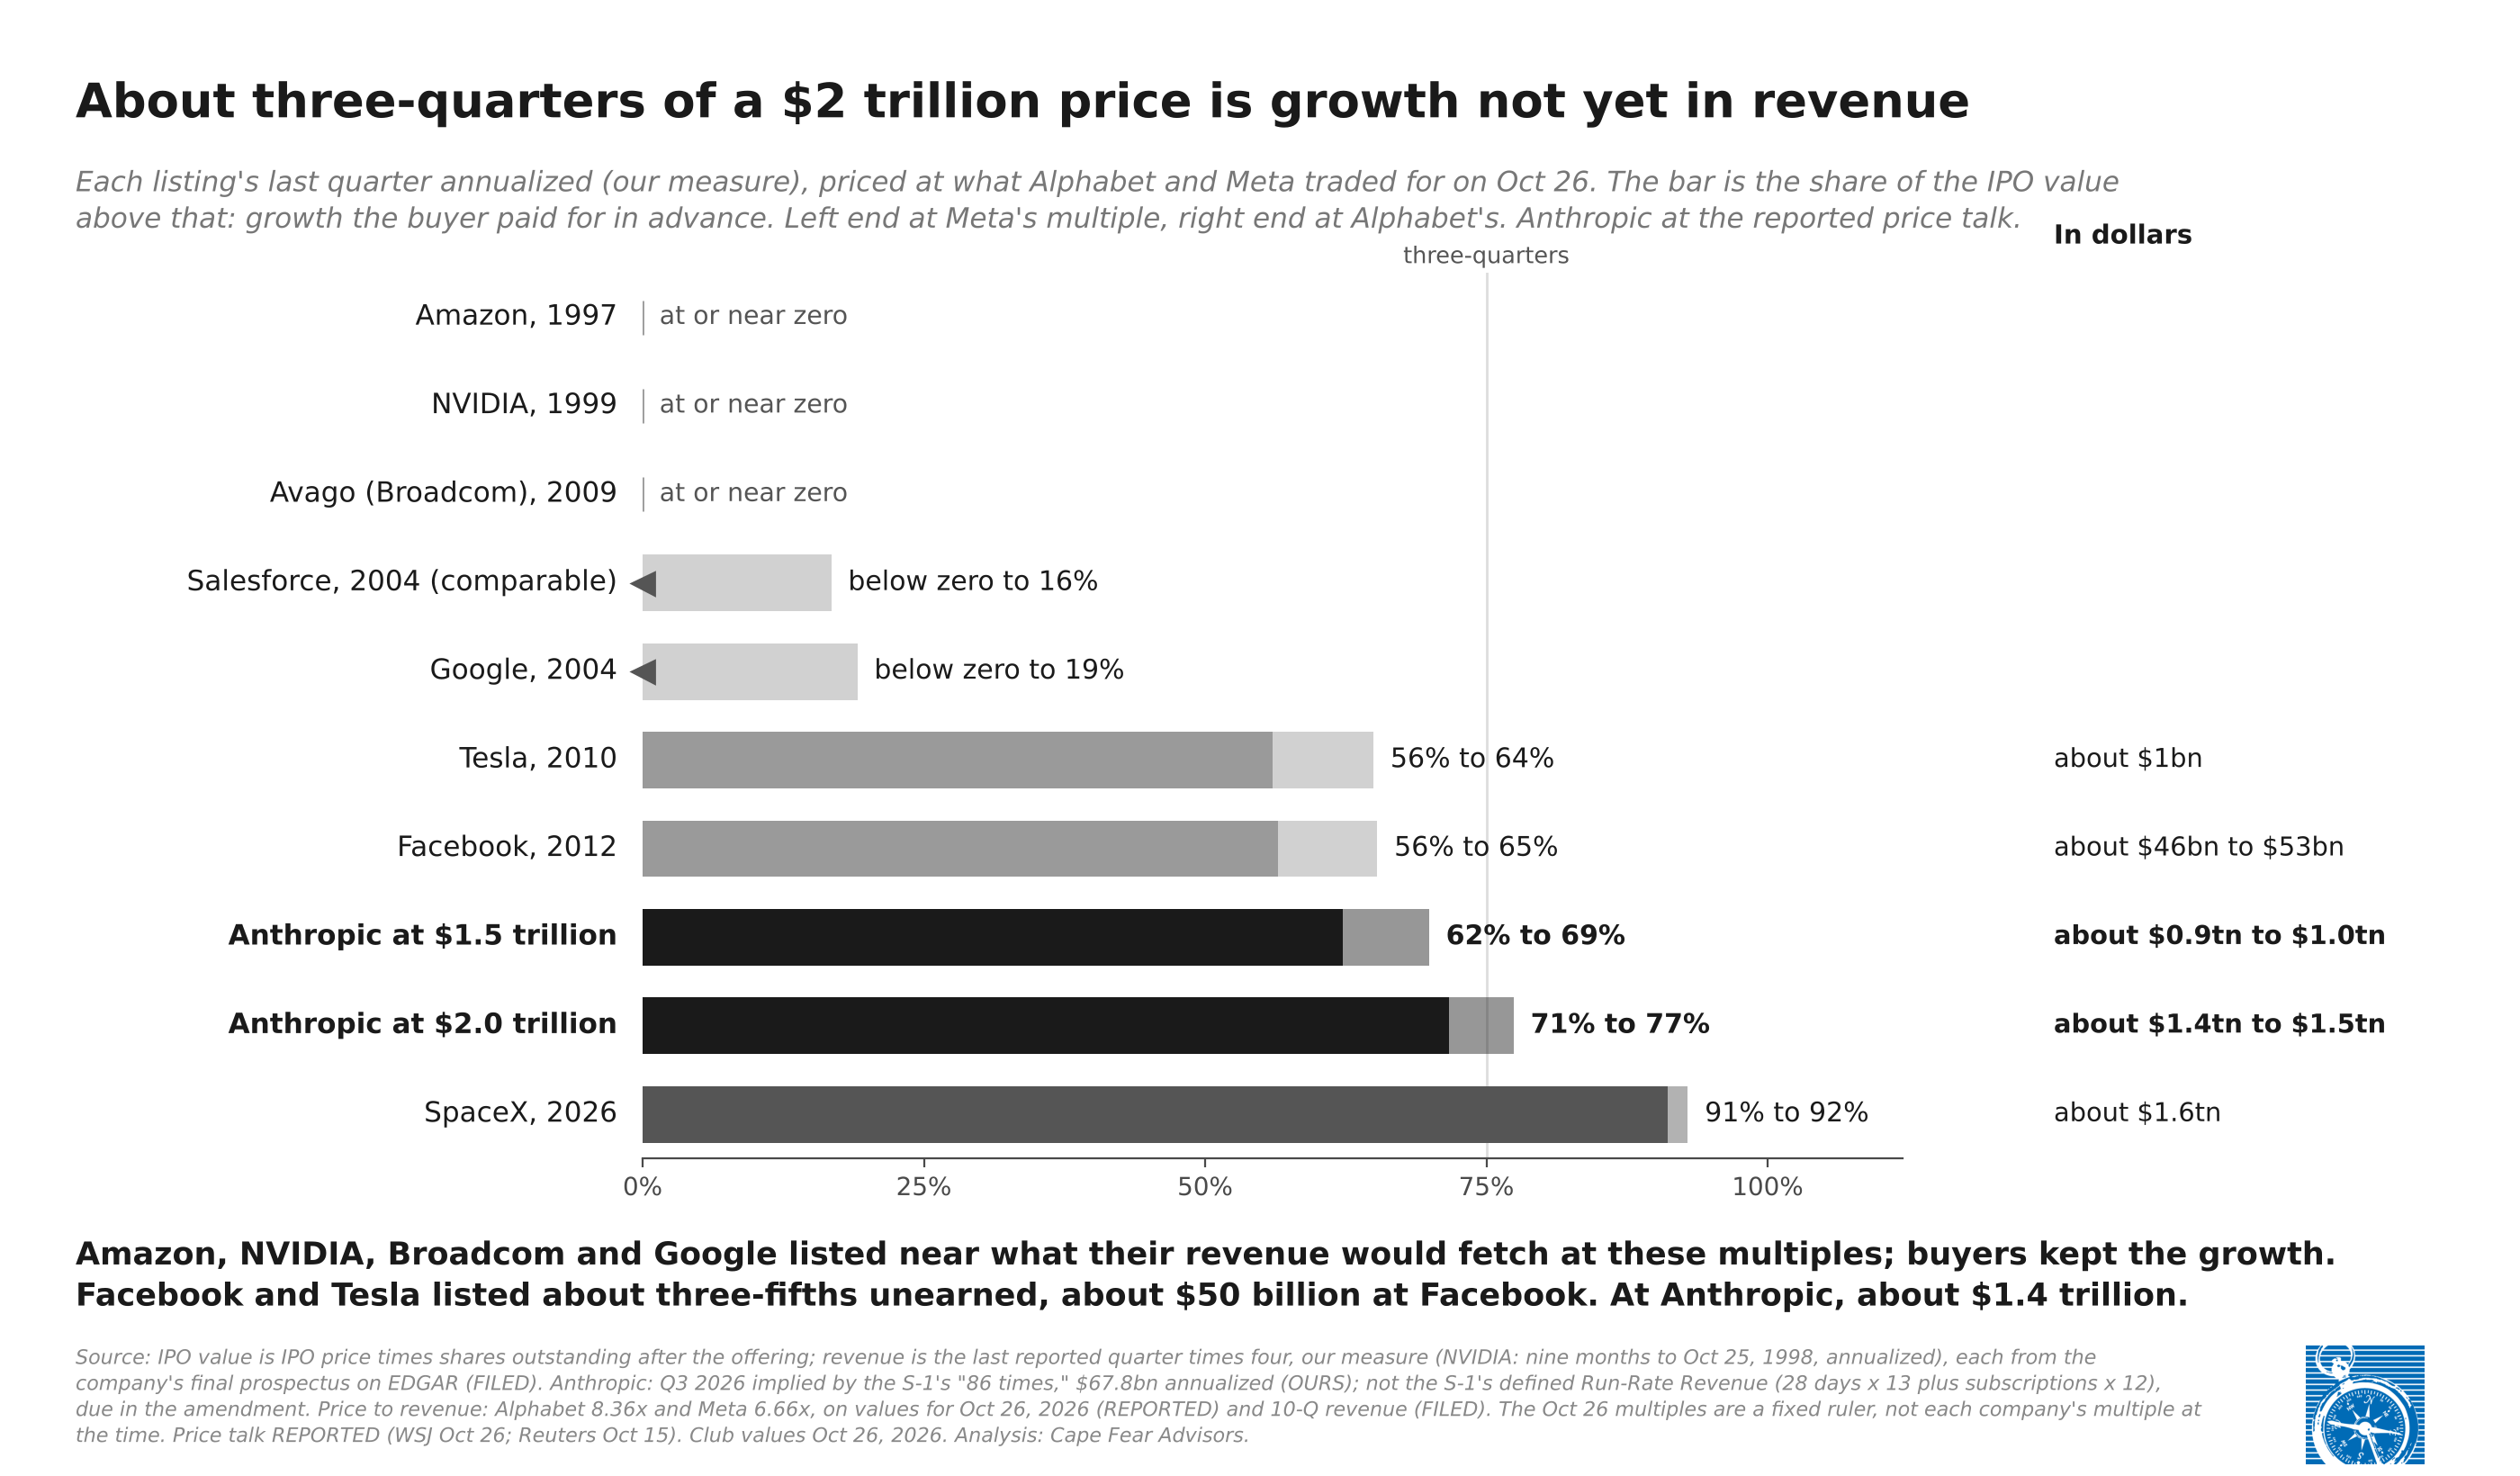
Amazon, NVIDIA, Broadcom and Google listed at or near what their revenue alone would fetch at those multiples, and their buyers kept the growth. Facebook and Tesla listed with about three-fifths of the price unearned; in Facebook's case, about $50 billion. At $2 trillion, about 71% to 77% of Anthropic's price is growth not yet in revenue, about $1.4 trillion to $1.5 trillion. At $1.5 trillion the share is 62% to 69%. SpaceX, which listed this year, sits higher still, at 91% to 92%. The ruler favors Anthropic: Alphabet and Meta are mature, profitable and priced as such.
A lead, measured by the growth of growth
The S-1 claims a particular kind of advantage. It uses the word moat zero times and switching cost zero times. The one time it mentions lock-in, it is selling customers on avoiding it: distribution across three clouds provides "deployment flexibility and avoiding vendor lock-in." (8)
What it claims instead is speed. "Our scale and growth create self-reinforcing loops that make Claude better over time and that we believe create durable competitive advantages." The risk section describes the other side of that advantage: "Even minor degradations in model performance or increases in response latency could cause customers to reduce usage or switch to competitors." (9)
That is a lead. A moat holds customers when a rival catches up; a lead holds only as long as the company improves faster than its rivals, so the quantity that matters is the rate of change of growth, the second derivative. Anthropic's growth case rests on staying at the frontier: revenue from models less than six months old was over 80% of its third quarter. (10)
The price needs the lead to keep compounding, and the filing says customers move when it slips. Apollo's chief economist reported on October 24 that revenue per worker and profit margins across the S&P 493 have not moved so far, and that mainstream companies do not need the newest models. His finding concerns the evidence so far, and it locates the question: the lead earns its premium where buyers want the frontier. (11)
Six quarters, eight growth rates
A lead is measured by the growth of growth, and six quarters are too few to measure it. Google listed with ten quarters of history and Facebook with nine. Anthropic's S-1 shows six full quarters, the fourth quarter of 2024 in text, and the third quarter of 2026 as a ratio. (12)
The growth rate of a company that young depends on how it is measured. We measured it eight ways from the filing: each of the last two quarters on the one before, annualized; each on the same quarter a year earlier; the last two quarters together, annualized and against the year-ago pair; the whole window's geometric rate; and trailing twelve months on the prior twelve. Anthropic's current growth rate runs from 362% to 3,459%. (13)
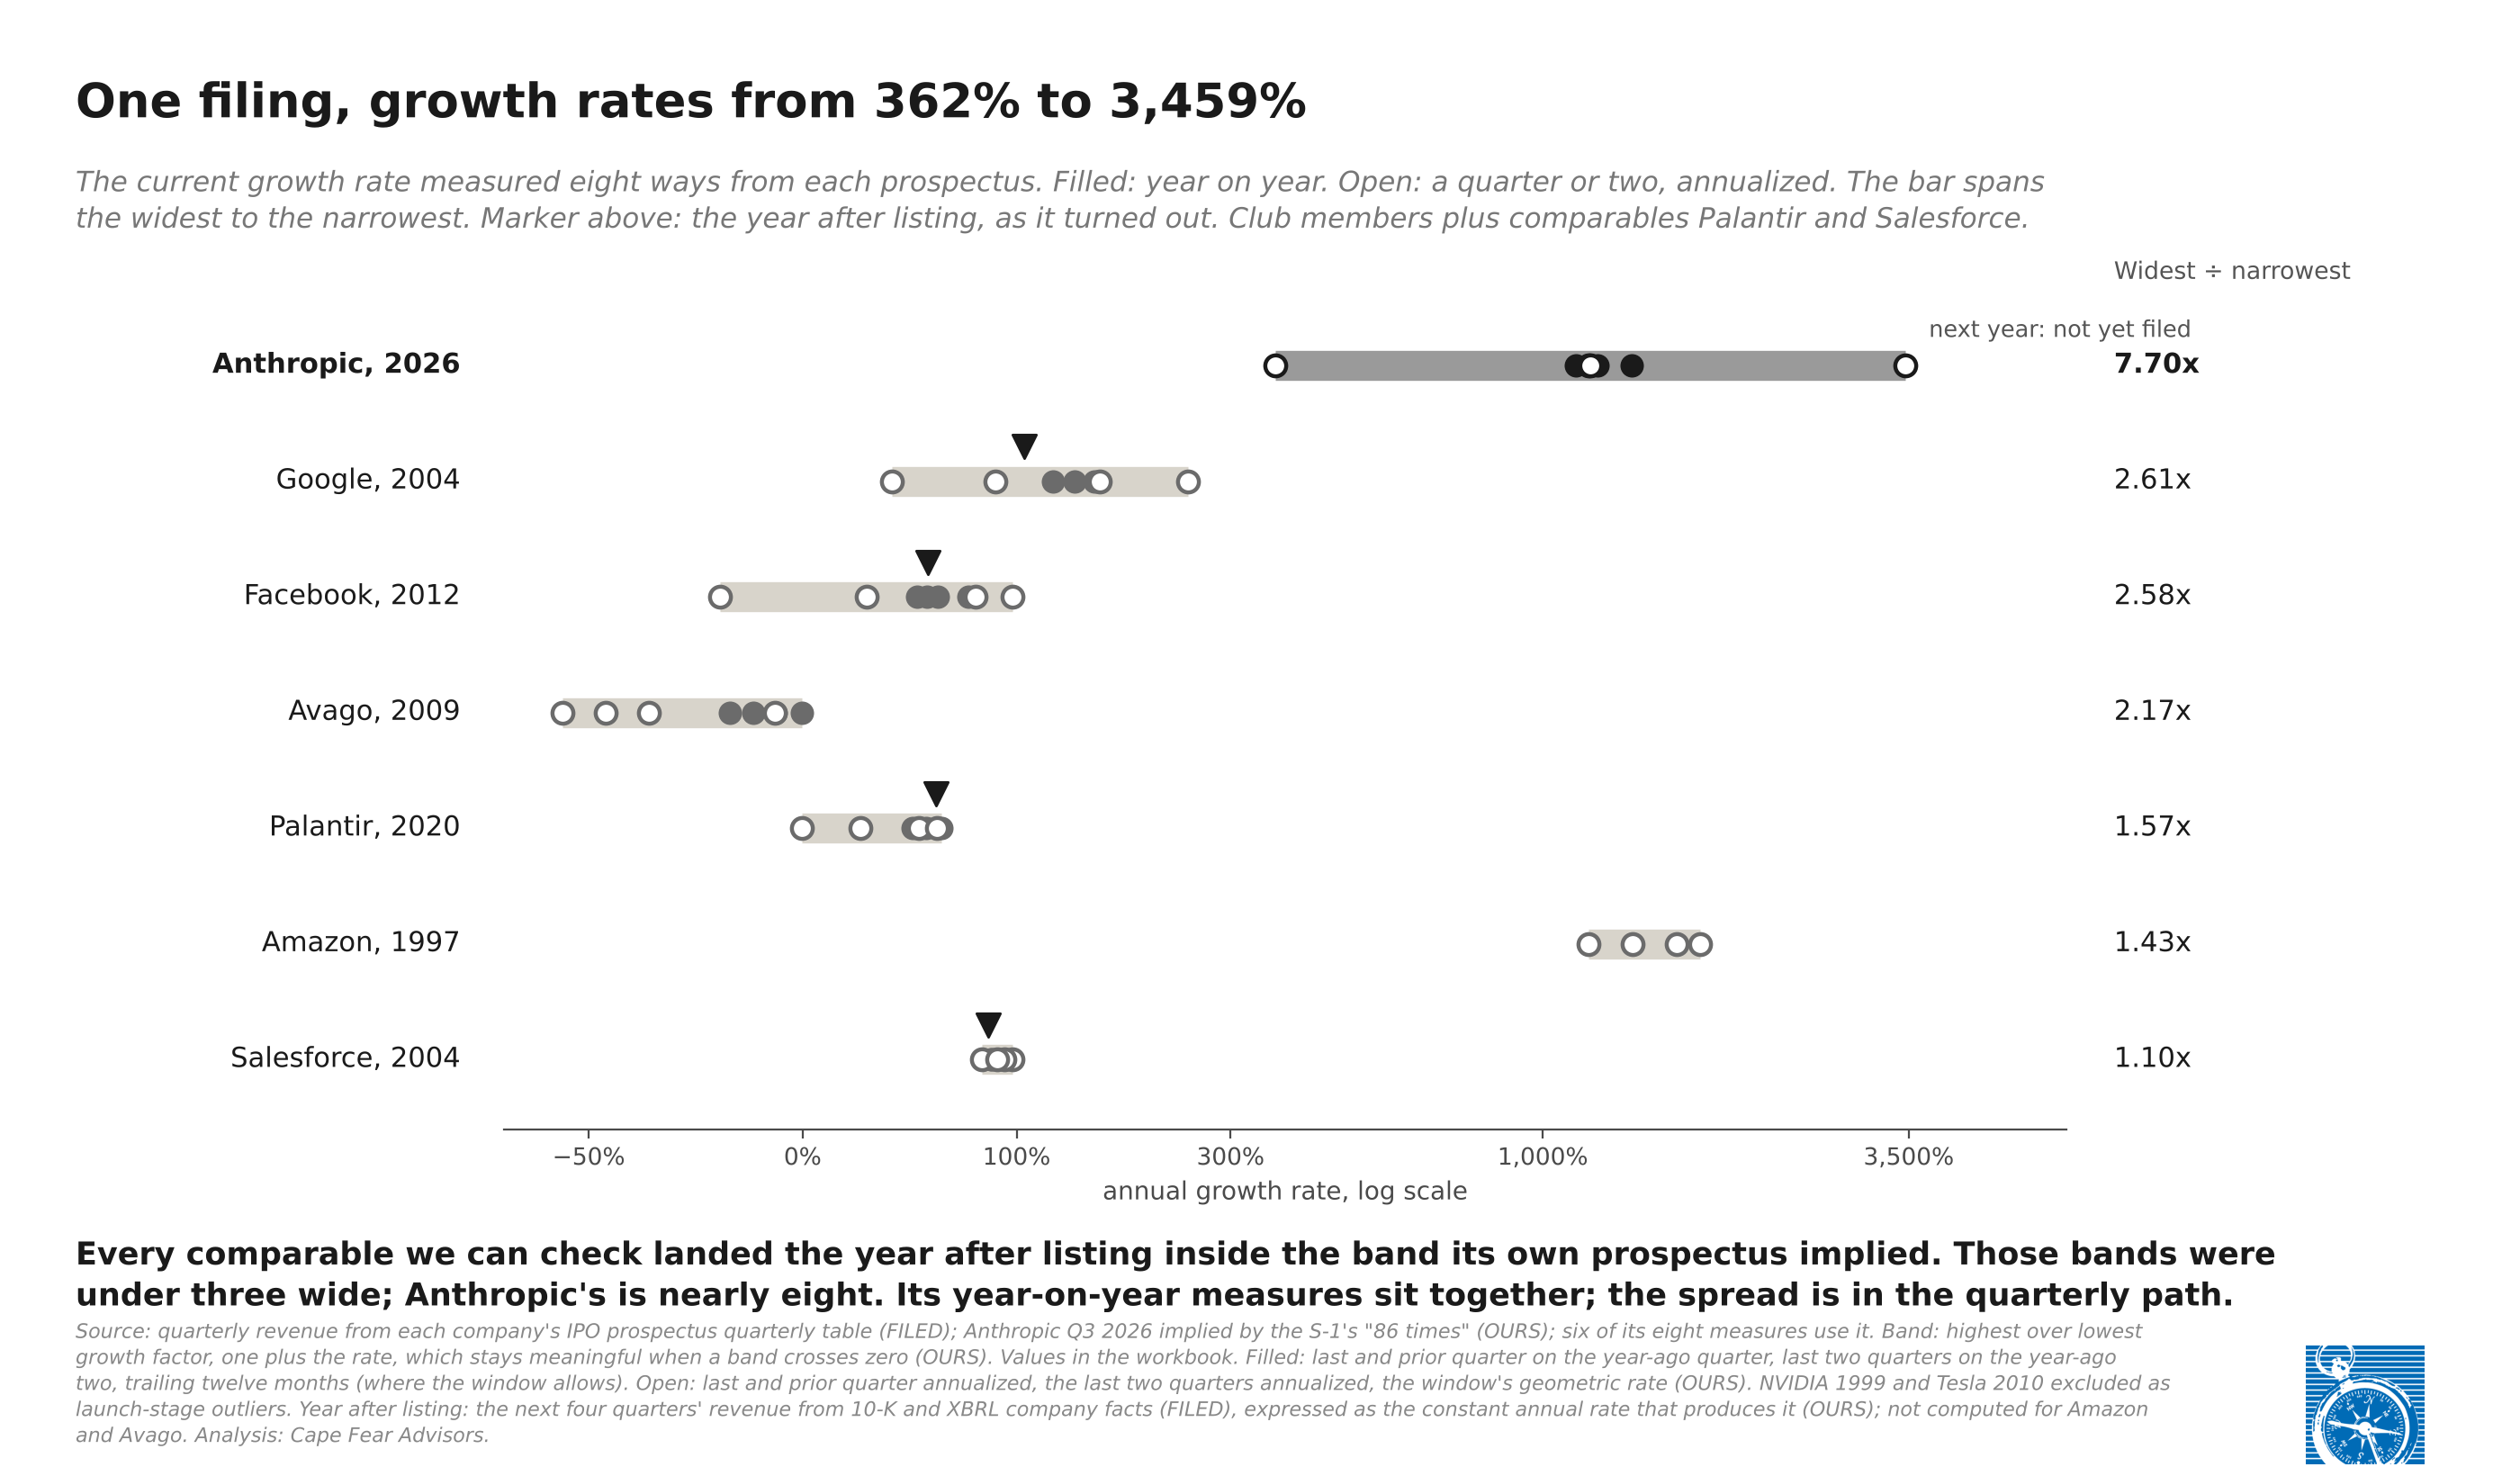
The same eight measures for each comparable produce bands under three wide, highest growth factor over lowest. Anthropic's is 7.70. Every comparable we can check landed the year after listing inside the band its own prospectus implied, Salesforce's inside a band only 1.10 wide. On the same construction, Anthropic's band puts the next four quarters at about $193 billion to about $992 billion. The slowdown path, about $82 billion, sits below it. (14)
The width is in the quarterly path. Two single-quarter measures set the whole band: the third quarter annualized at the bottom, 362%, and the second quarter annualized at the top, 3,459%. The other six sit between about 1,126% and 1,368%, as tight as Google's. The quarter-to-quarter rates swing because the business moves on model releases: after Opus 4.5 launched, quarterly growth went from 48% to 132%, and from the second quarter to the third of 2026 it slowed from 144% to 47%. The filer says what that does to a reading of the trend: "Our historical growth rates may have masked the impact of seasonal trends on our results." It also says, "We expect our revenue growth rate to decline over time," without saying how fast. The comparables' record favors a next year inside the band, and the filer's expectation leans toward slower growth. (15) The S-1 also reports net revenue retention of about 900%, a figure that combines more users, more usage, price cuts and new products with no split among them, so we read no retention rate from it. (16)
What more history buys shows in how the bands moved as quarters were added. We recomputed each band at every length of history the prospectuses allow.
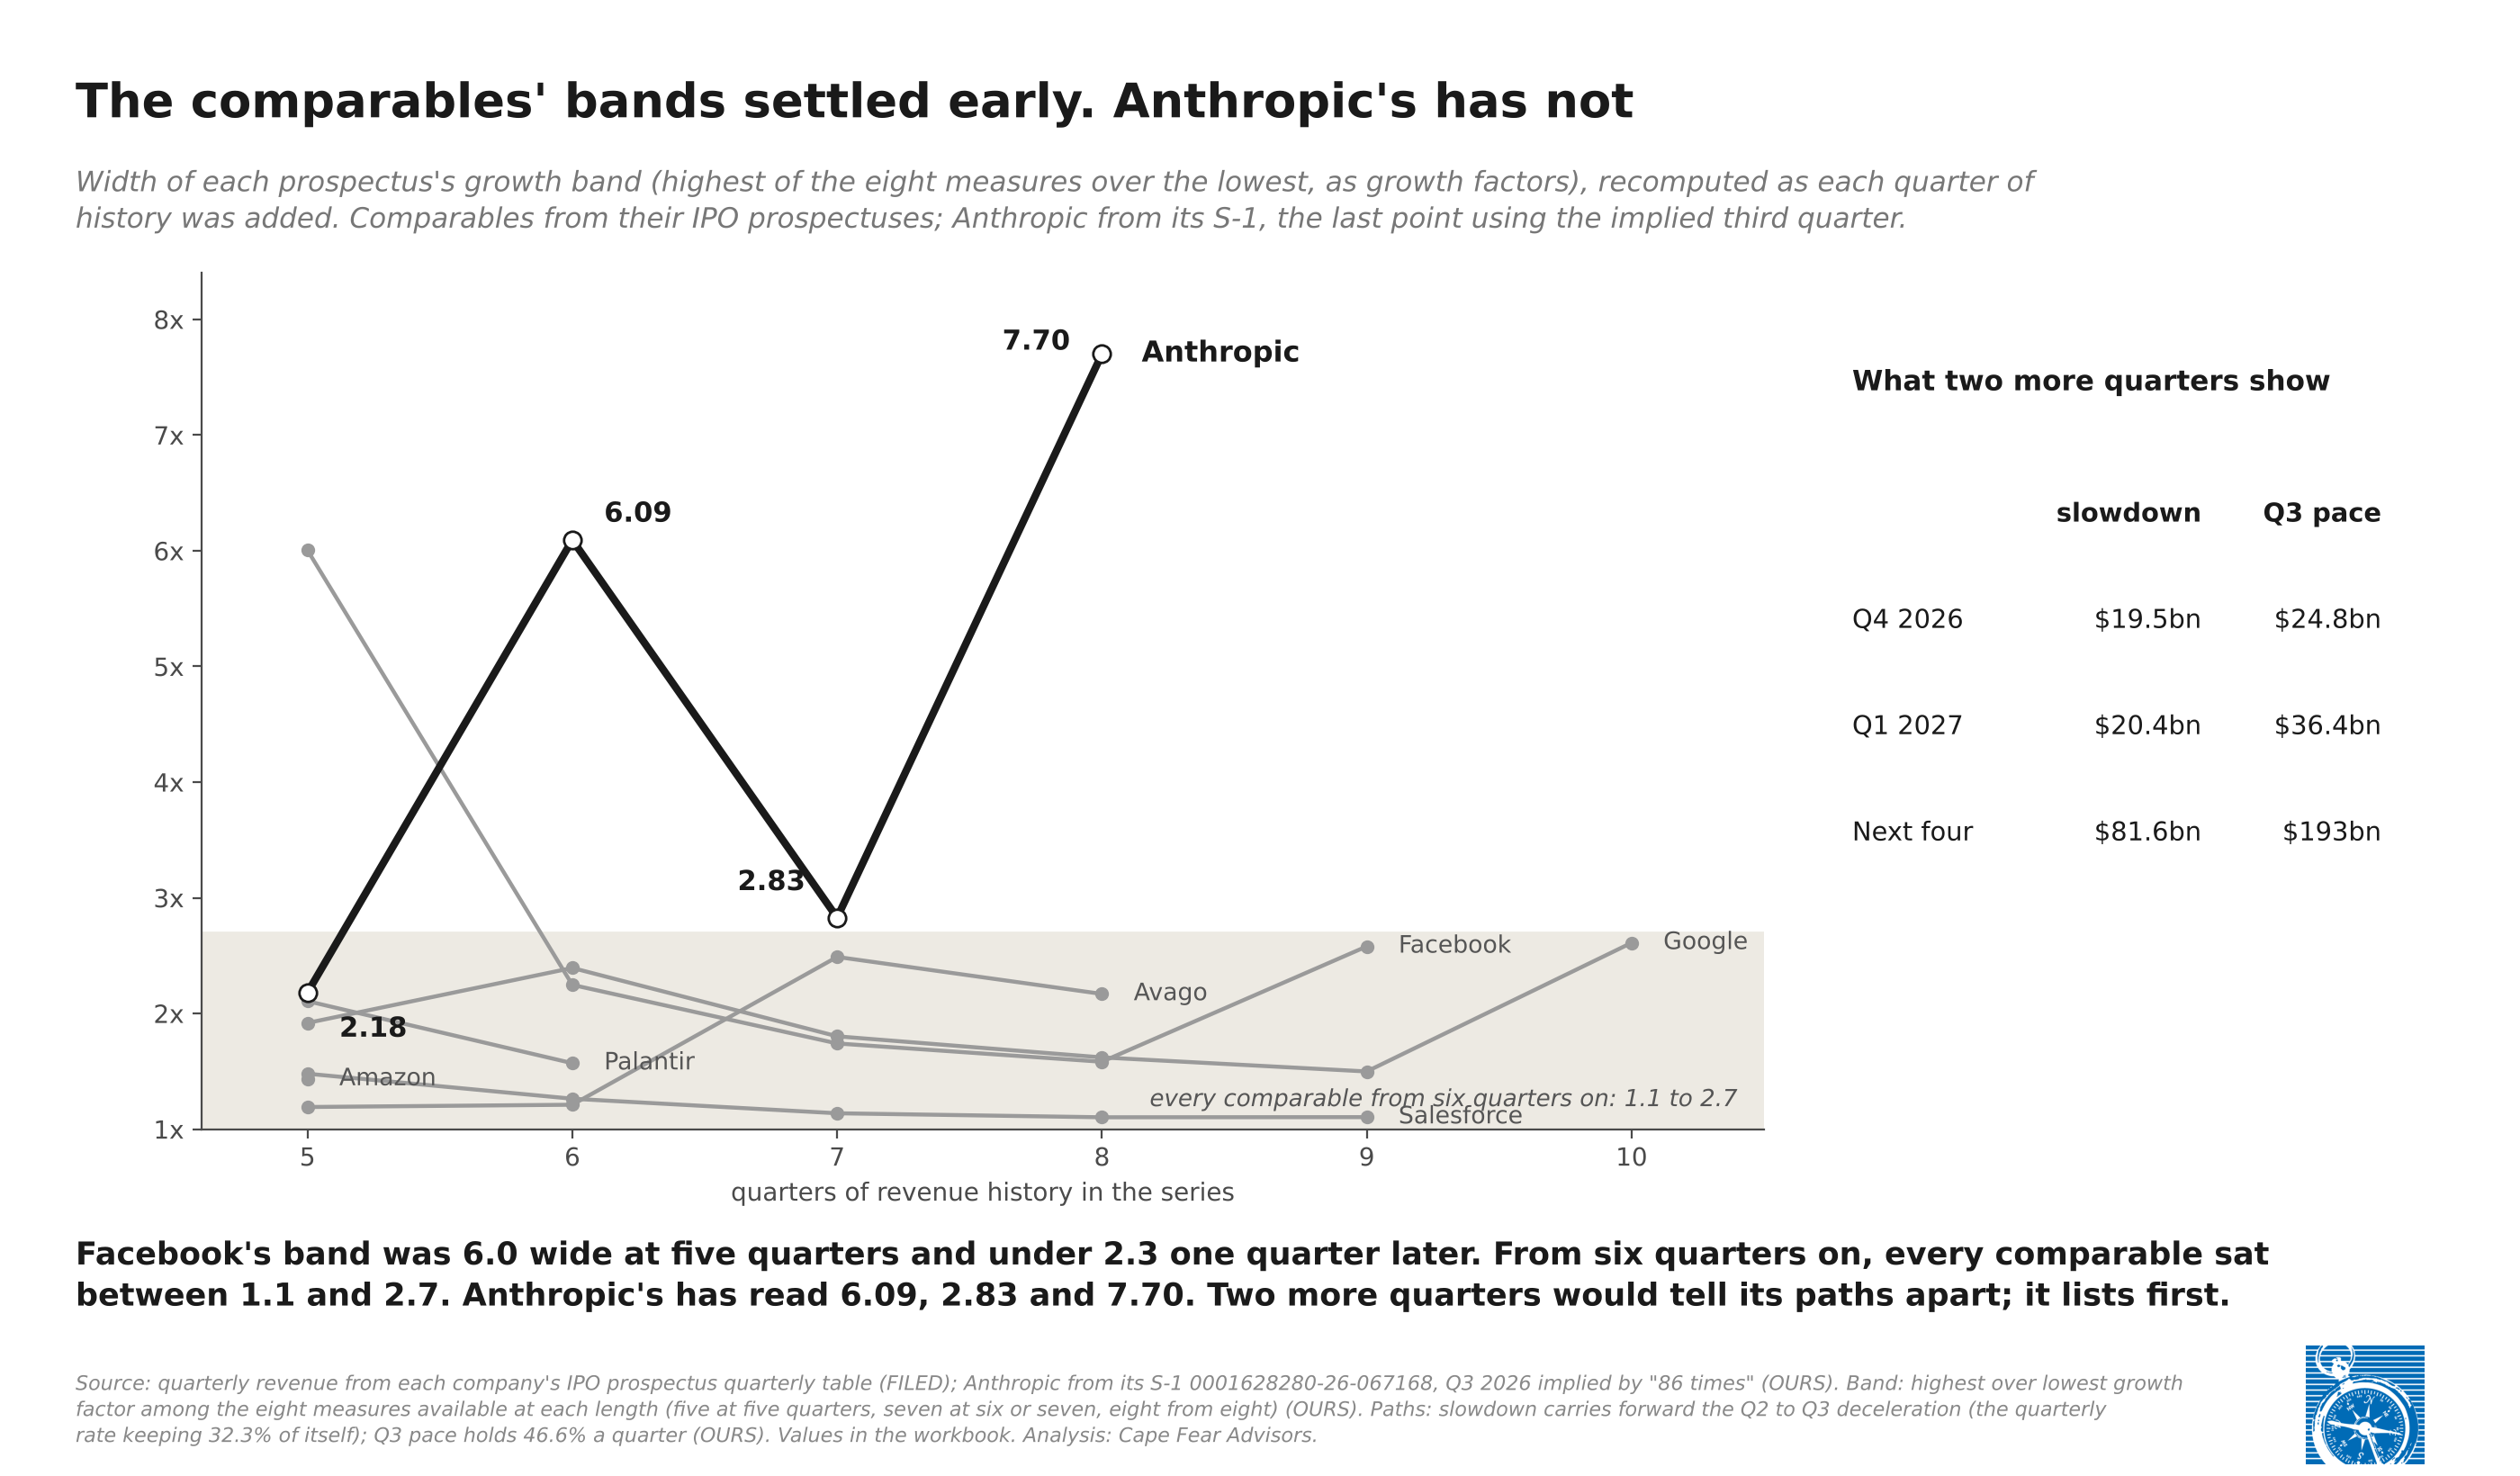
The comparables' bands settled early. Anthropic's has not. Facebook's band was 6.0 wide at five quarters and 2.25 one quarter later. From six quarters on, every comparable sat between 1.1 and 2.7. Anthropic's, at six, seven and eight quarters, has read 6.09, 2.83 and 7.70: each new quarter has moved the width of its band by a factor of two to nearly three. Anthropic lists before the next two quarters are reported. (17)
Ten years of price
The arithmetic has two inputs the filing leaves open. Next year comes first, and on a plain scale the paths part within a quarter or two.
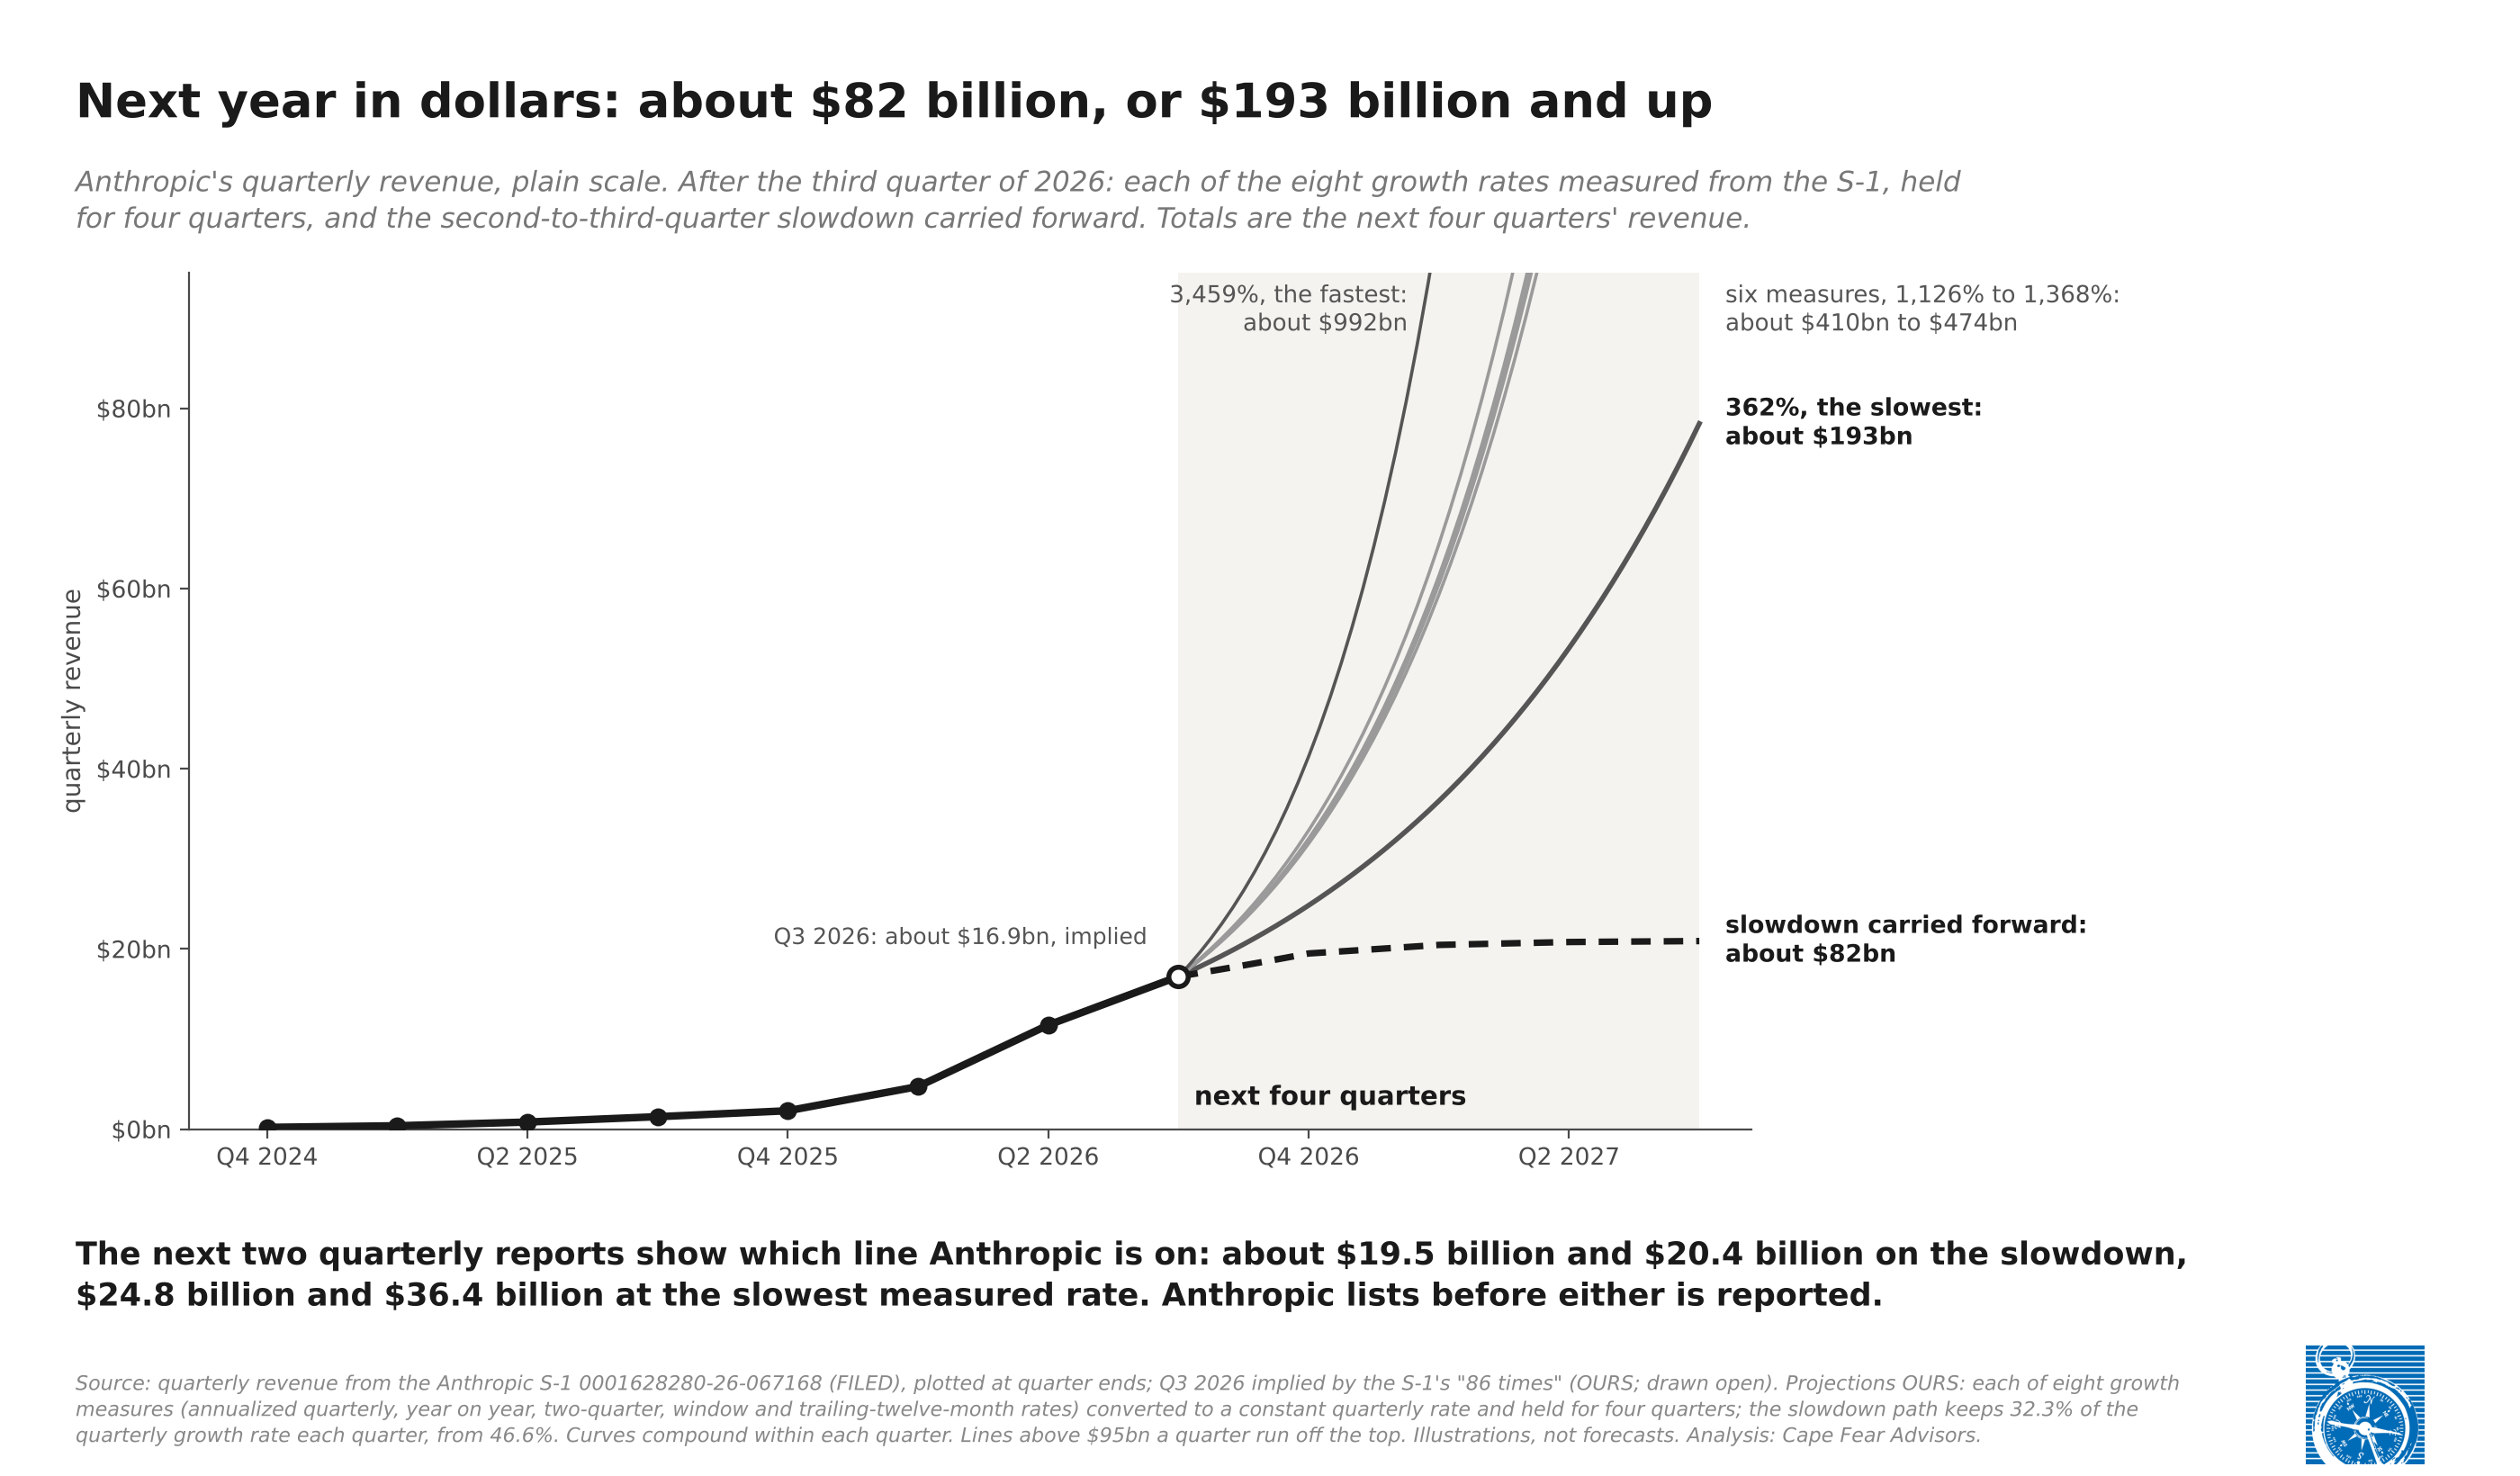
The decade compounds on whichever year arrives, and at this size every point of growth carries a long string of zeros: one more point a year for the nine years after the slowdown adds about $29 billion to year-ten revenue, and about $150 billion to the price that pays a Treasury at Alphabet's multiple, 7.5% of $2 trillion. (18) A log scale keeps those rates in view where dollars would run off the page, so the face below draws both inputs that way: year one on each path the six quarters support, then nine years at the slowest and fastest of the club's paces from this size.
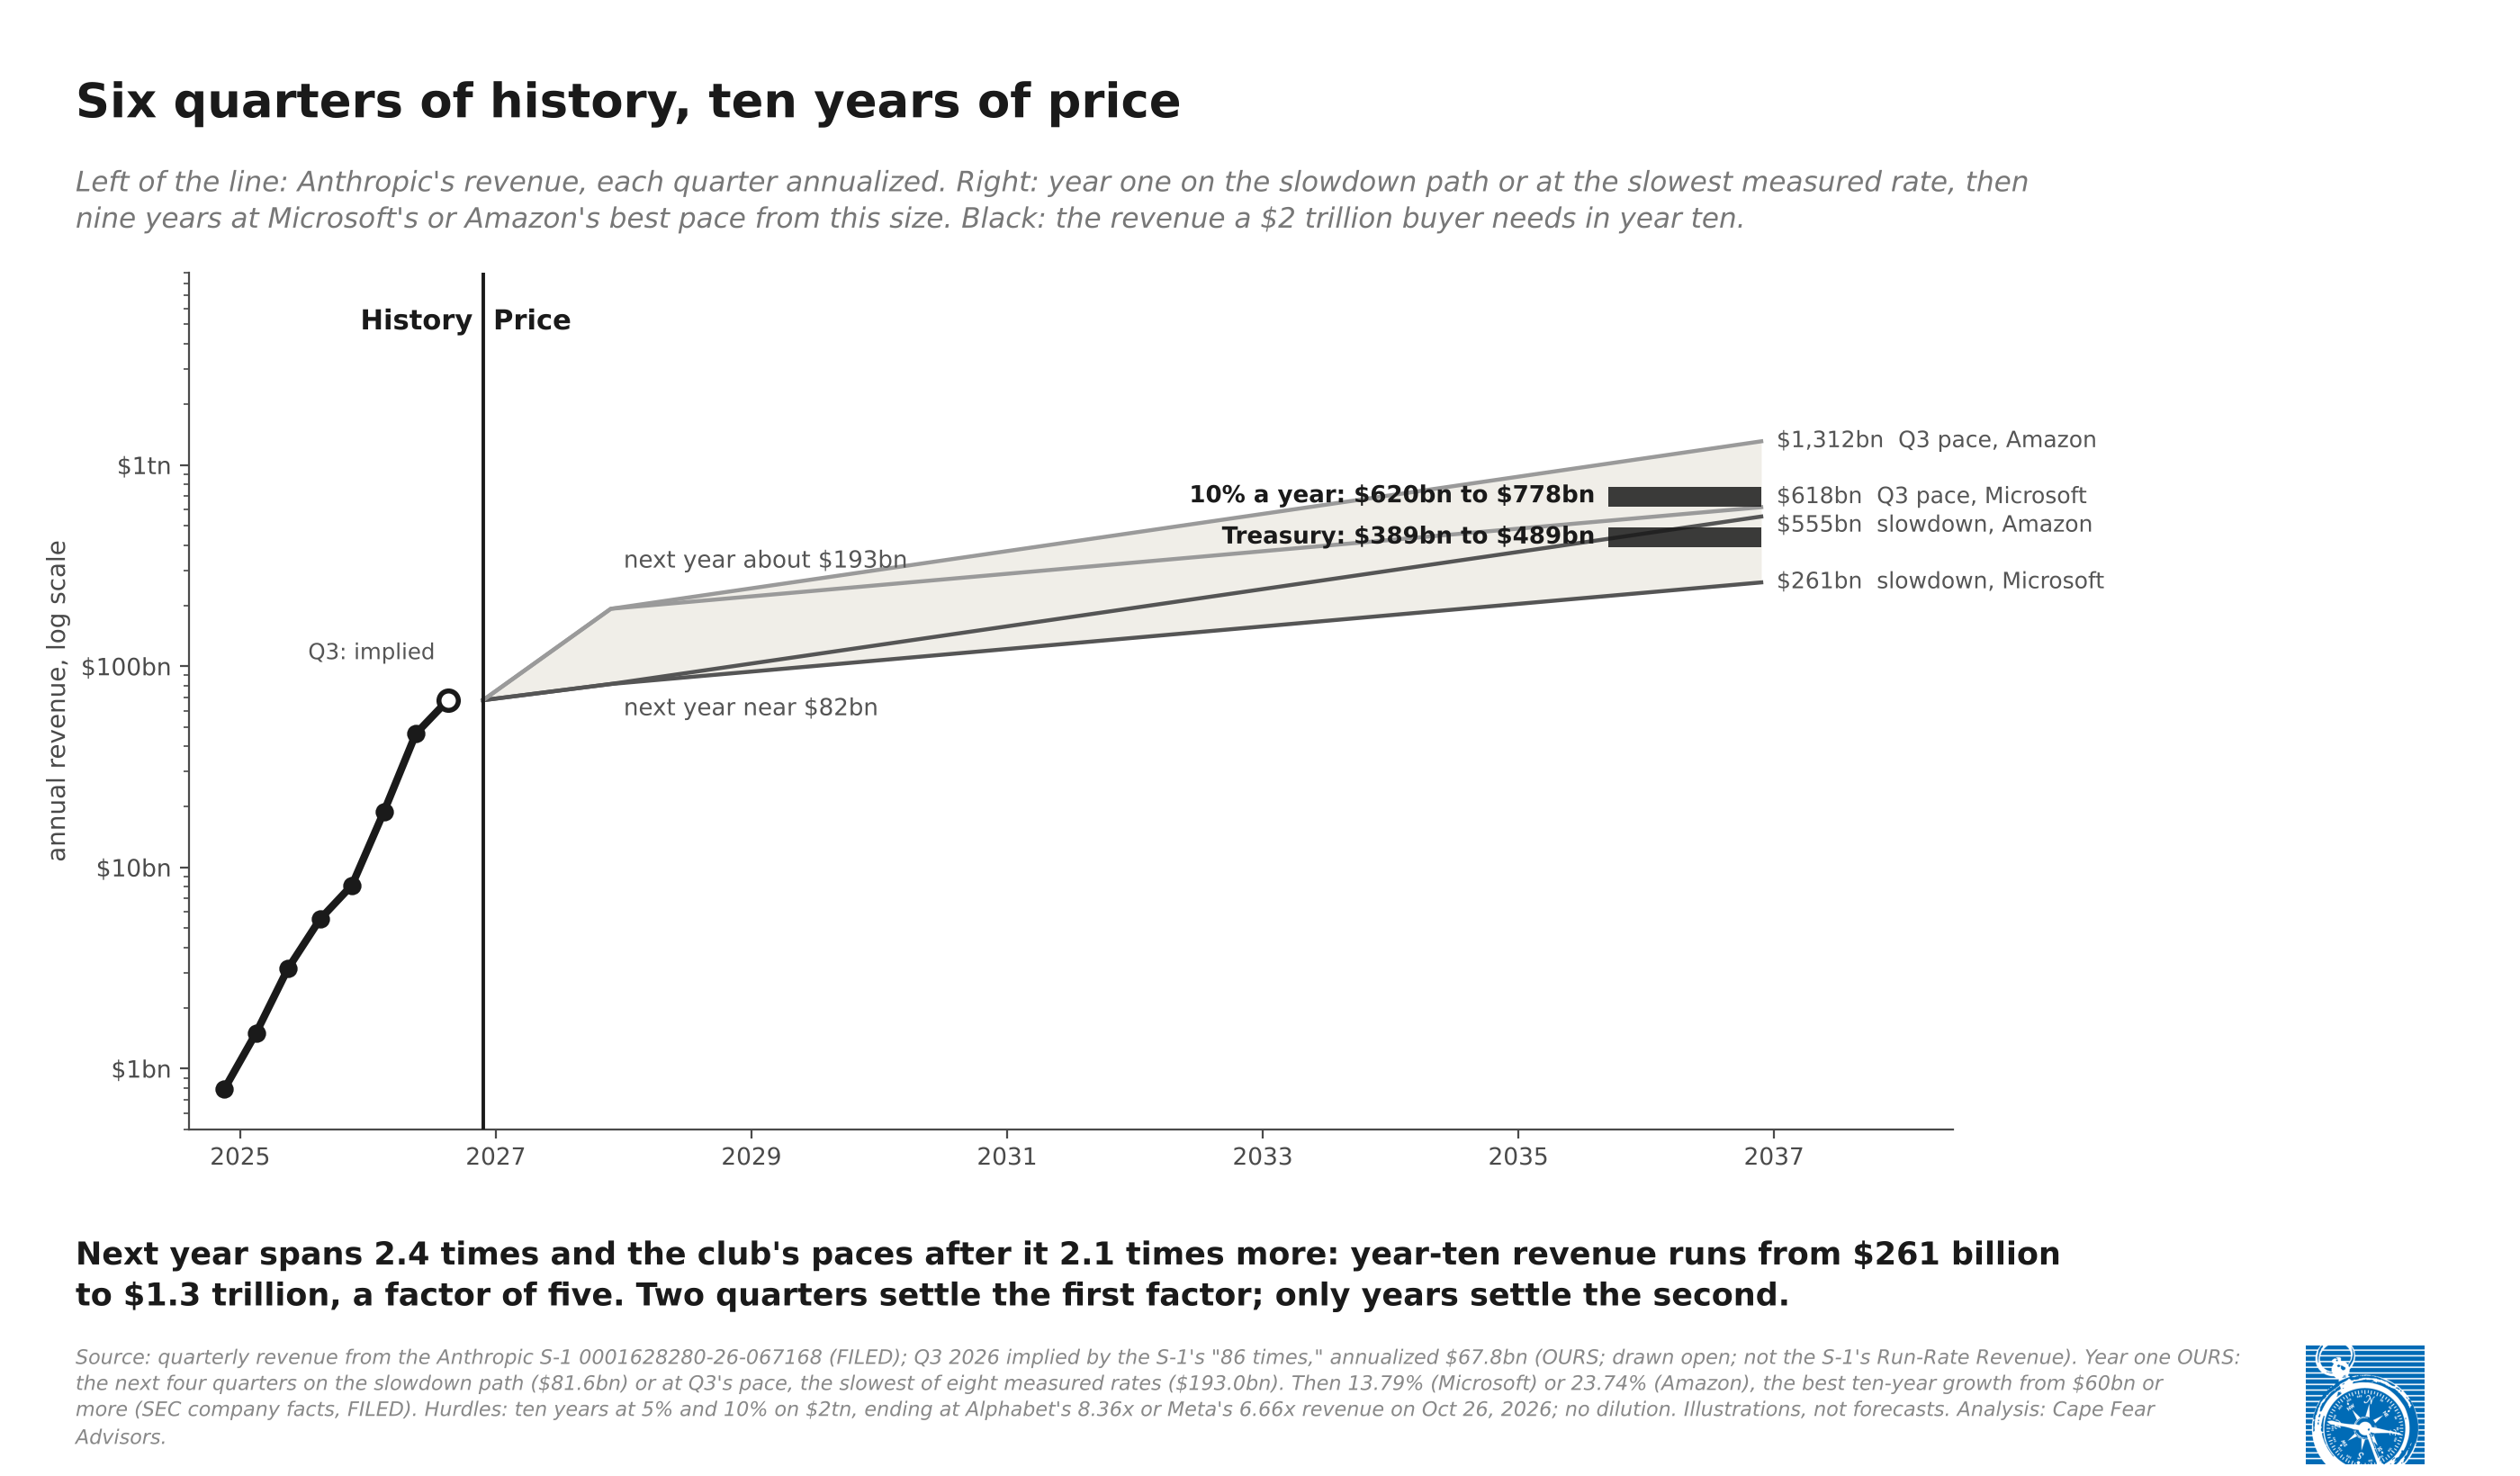
For a buyer at $2 trillion to match a ten-year Treasury, about 5%, revenue in year ten has to reach $389 billion to $489 billion, depending on whether it then trades like Meta or like Alphabet; for 10% a year, $620 billion to $778 billion. Measured the way the club's decades are measured, from one year's revenue to another's, Anthropic's last four quarters, $35.3 billion, have to compound at 27% to 30% a year for ten years to match a Treasury. The best decade in the club's record from that size is Amazon's from 2010, at 27.4%. That base carries last year's smaller quarters, which is why year one decides so much below. From today's annualized rate, which favors Anthropic, the hurdle is 19% to 21% a year. (19)
At the third quarter's pace, Anthropic adds about $158 billion of revenue next year, half again the largest one-year gain any company in the club has posted, Amazon's $105.5 billion in 2020. The rock gets heavier by the growth rate every year, for ten years.
After year one, revenue is past $60 billion on either path, and four members of the club have a full ten years on record from that size; Broadcom, Meta, NVIDIA and Tesla passed it too recently. Their best decades: Amazon at 23.7% a year (2012 to 2022), Alphabet at 18.3% (2015 to 2025), Apple at 15.5% (fiscal 2010 to 2020) and Microsoft at 13.8% (fiscal 2016 to 2026). Of these four, only Amazon's clears the hurdle from today's rate. The threshold moves with the base, so Amazon's record appears twice: 27.4% a year from $34 billion in 2010, and 23.7% from $61 billion in 2012. (20)
The software listings that grew fastest, Snowflake, Datadog, Twilio, Workday and MongoDB, each slowed year by year, and none held above 30% for a decade after listing; each started from a base 30 to 600 times smaller than Anthropic's. Faster decades exist from smaller bases: Meta and NVIDIA each compounded about 46% a year, from under $2 billion and about $5 billion. Size is what the record measures. Palantir shows decay need not run in one direction: its growth fell to 17% in its fourth year and reaccelerated to 56% in its sixth, on AI demand. (21)
The two unknowns multiply. Next year's revenue spans 2.4 times, from the slowdown path to the slowest measured rate. Nine years at the club's paces, Microsoft's to Amazon's, span another 2.1 times. Year-ten revenue therefore runs from about $261 billion to about $1.3 trillion, a factor of five. Two quarters can settle the first factor. Only years settle the second. (22)
The price of a growth rate does not fade with history. On October 28, Alphabet, public for 22 years and the source of this piece's ruler, reported search growth of 12%, after 17% in the second quarter, services revenue about 2% below analysts' estimates, and $51.4 billion of quarterly capital spending that left free cash flow at -$9.1 billion, with more to come in 2027. Google Cloud grew 103%. Alphabet's shares fell about 10% after hours, by The Wall Street Journal's account, and nearly 11% before the next morning's open, by The New York Times's; Microsoft, reporting $18.6 billion of free cash flow after $39.4 billion of capital spending, rose. By both outlets' accounts, the market weighed growth against AI spending at a company with 22 years of history; at $2 trillion, it weighs the same two things at one with six quarters. (23)
The company can win and the buyer can still lose
The same arithmetic, run forward, gives a buyer's annual return over ten years. Because the history cannot pick next year, we run it two ways: year one on the slowdown path, about $82 billion, or at the slowest of the eight measured rates, about $193 billion, then nine years at each club member's best pace from this size. The faster path then steps down from its own exit rate, which understates it. Each result is priced at Meta's or Alphabet's multiple and set against $2 trillion. We assume no dilution, which flatters every result, and round every endpoint up, in the buyer's favor. (24)
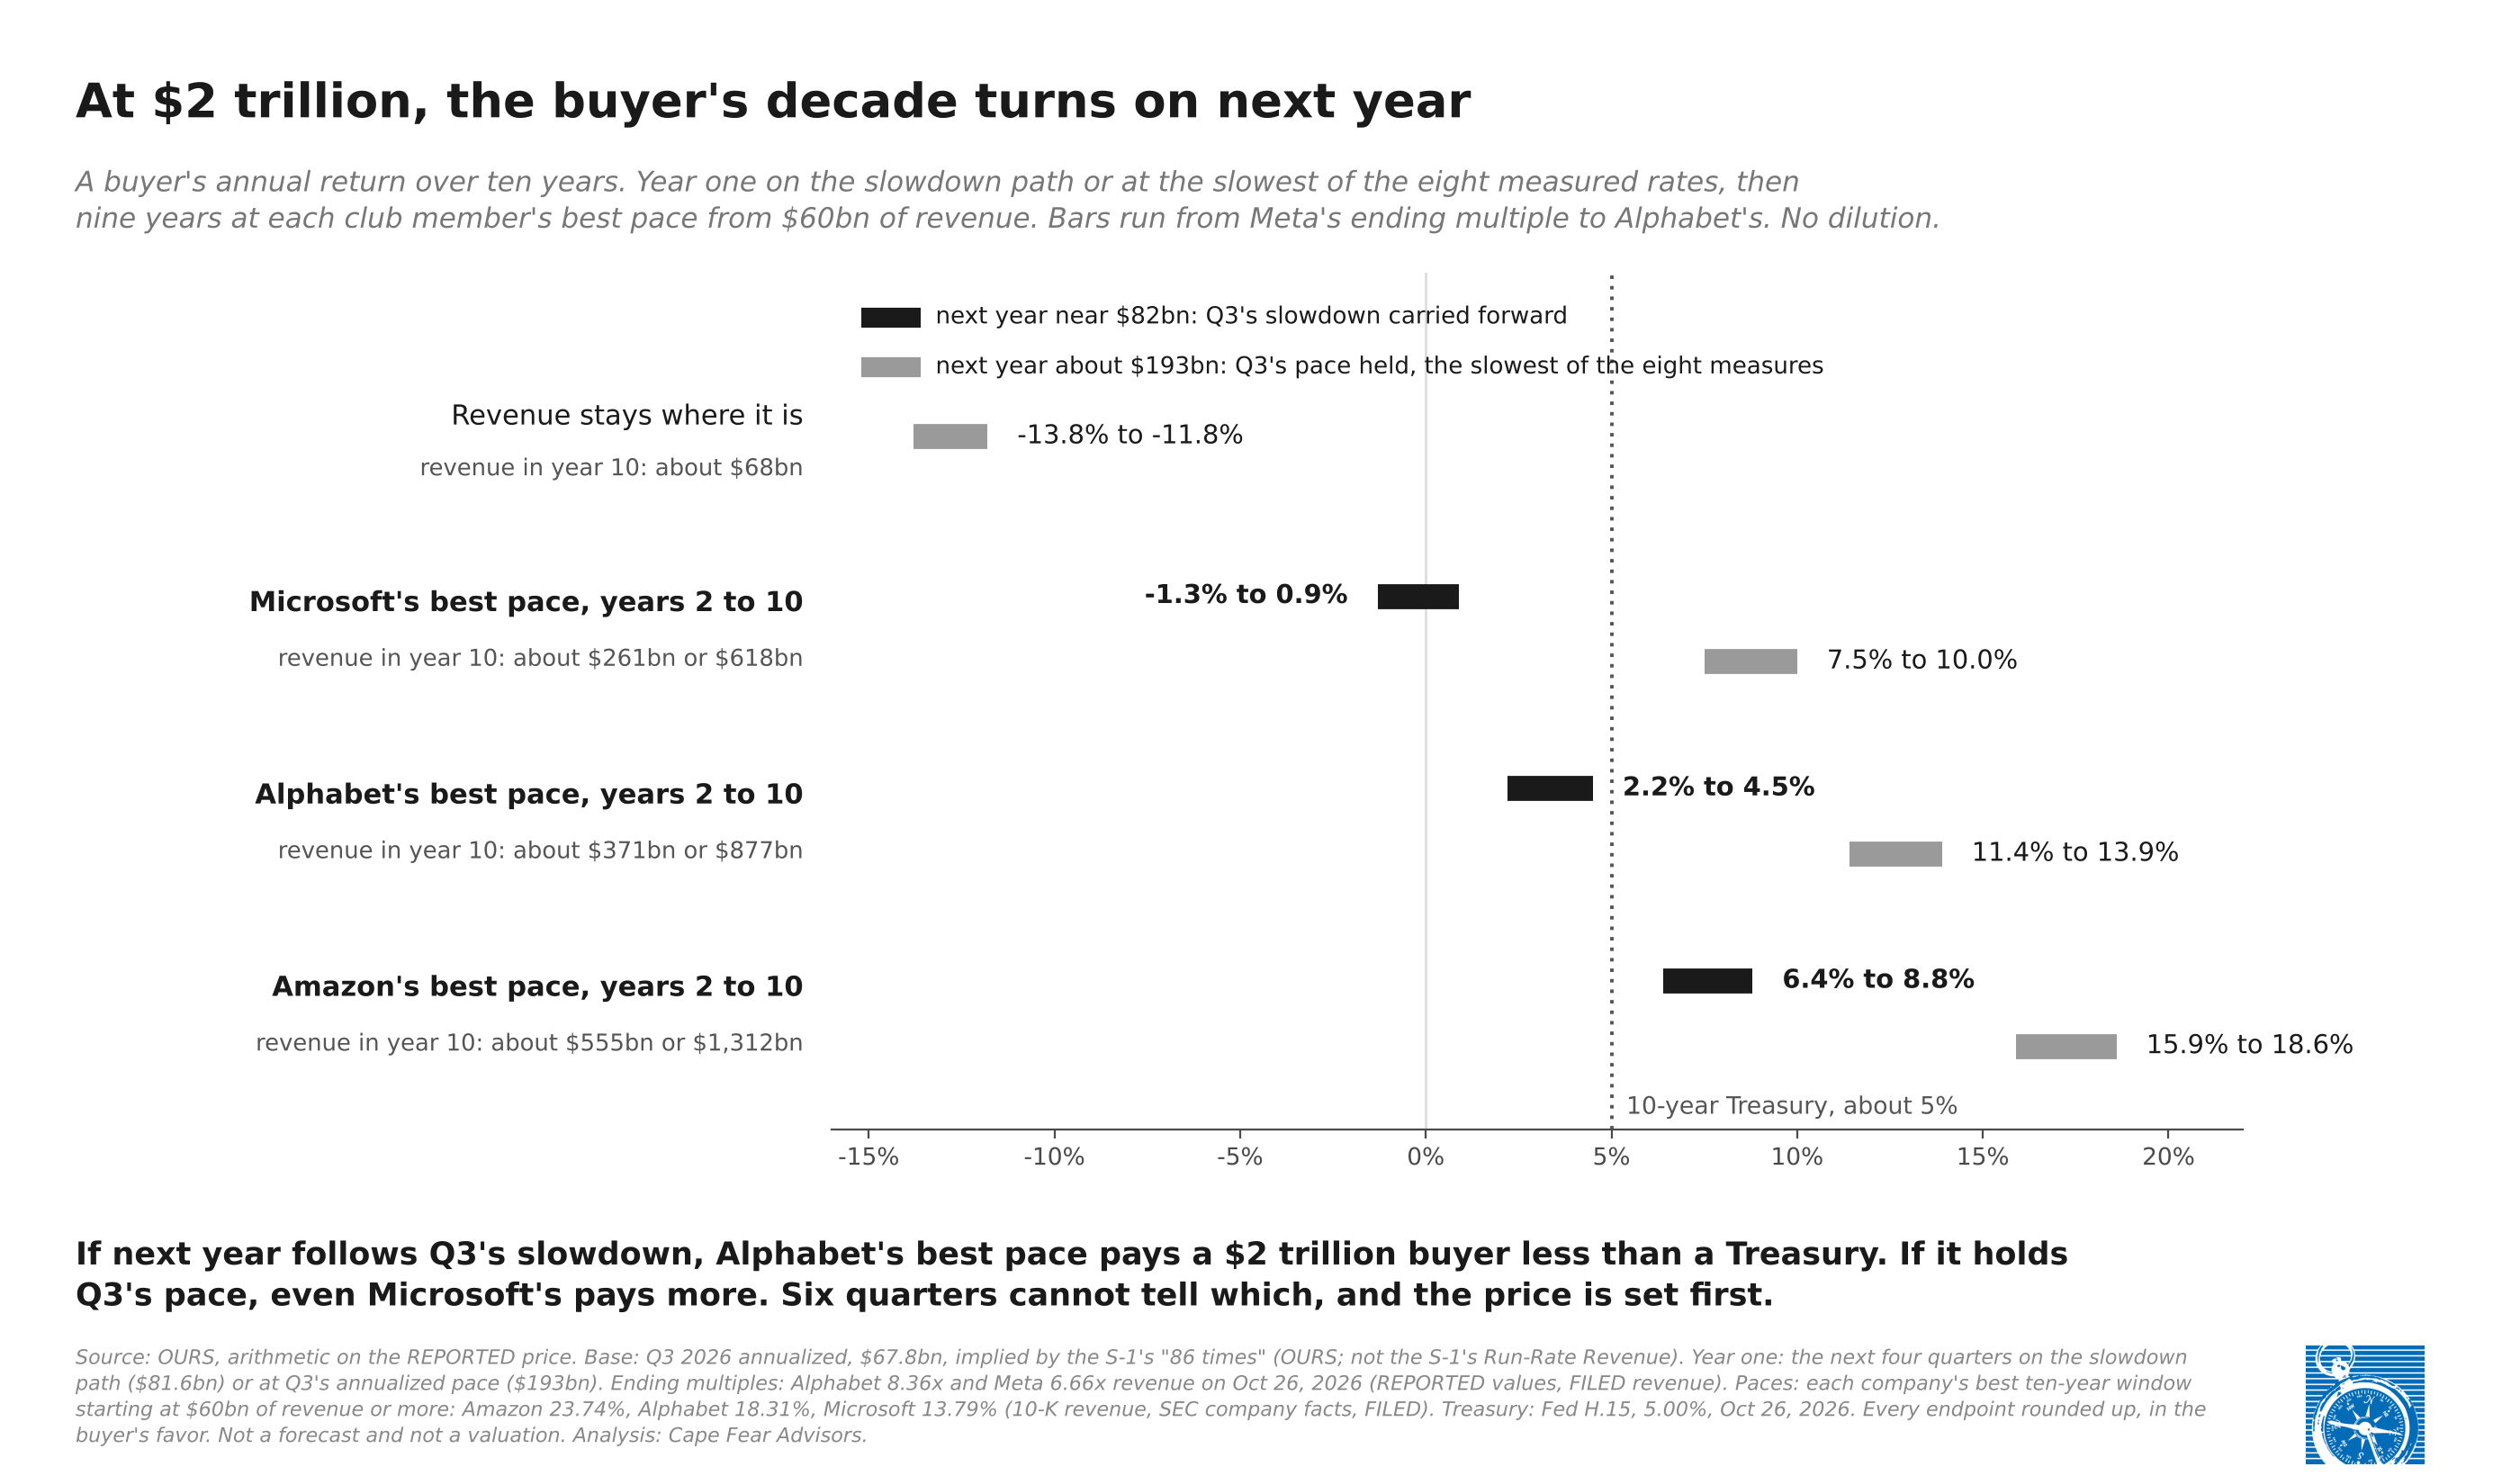
If revenue stays where it is, Anthropic would still trade at about $452 billion to $567 billion at those multiples, and a buyer at $2 trillion is down more than 70%; a stalled company would more likely trade below those multiples, so even that flatters.
If next year follows the third quarter's slowdown, Anthropic can then grow at Alphabet's best pace from this size and the buyer still earns 2.2% to 4.5% a year, less than a Treasury; only Amazon's pace clears it, at 6.4% to 8.8%. If next year holds the slowest measured rate, even Microsoft's pace pays 7.5% to 10.0%. Over the whole decade from today's rate, that faster path averages about 29% a year, more than any decade in the record from this size, and nearly all of the difference is year one. On the slowdown path, matching a Treasury after Alphabet's pace needs Anthropic to trade at about 8.8 times revenue in 2036; Alphabet traded at 8.36 times on October 26, after more than two decades as a public company. The miss is about half a point a year, and a move of about 5% in that multiple closes it, as would a year one about 5% above the slowdown path, near $85.8 billion.
That is the cost of not knowing. For a buyer to earn a Treasury with Alphabet's pace after year one, the price could be about $1.5 trillion to $1.9 trillion on the slowdown path, or about $3.6 trillion to $4.5 trillion at the third quarter's pace. Next year alone moves the price that pays a Treasury by more than $2 trillion, more than the price itself. The reported $2 trillion sits above what the slowdown path supports and well below what the faster path supports.
The risk in that bet is a venture's: six quarters of history, a lead rather than a moat, and at least $394 billion of fixed commitments. The returns that go with venture risk have accrued already, at fair value, to the holders who bought before the history existed: Amazon's convertible notes, about $6.2 billion of principal, were carried at $108.6 billion at June 30, about 17.5 times. The best cell on the payoff face, a year at the third quarter's pace and then Amazon's best decade, turns a public buyer's dollar into about 5.5 in ten years. At $2 trillion, the public buyer takes the venture's risk without the venture's price. (25)
Aswath Damodaran's valuation of October 28, on a story of revenue near $1 trillion by 2036, about 31% a year from our base, puts the equity at $1.475 trillion, more than a quarter below the top of the talk; it is a value and ours a return, and they point the same way. (26)
Two findings of our first read lower every return here. The S-1 reports revenue gross of the fees the cloud marketplaces keep, which we estimate at about 16 to 17 cents of each dollar, and it estimates that 5% to 7% of revenue in the nine months to September came from customers it later found to be breaking its terms, a share it expects to fall. Taken out of the base, the fees lower every return on the paths by about two points a year, enough that on the slowdown path even Amazon's pace falls short of a Treasury at Meta's multiple; the violating revenue lowers every return on the paths by about half a point to nine-tenths of a point. (27)
What else six quarters have not shown
Two more things the price assumes sit outside the record so far.
The first is which market Anthropic is in. The S-1 sizes it by who works and describes the product as making workers "meaningfully more productive." If customers' workers produce more, the market grows with capability. If customers do the same work with fewer people, the spend substitutes for wages and is contested on price. The S-1 defines its market on the productivity side; the evidence so far sits on the efficiency side. Anthropic's own economists put current models' contribution to US labor productivity growth at 1.8 points a year in November 2025, and in January at between 0.6 and 2.6 points, depending on how the tasks AI speeds up interact with the ones it does not. The S-1 contains the phrase "productivity growth" zero times. (28)
Which market it is also decides whether the compute that keeps Claude at the frontier is a running cost or an investment, a split the filing says it cannot measure; our first read put the first-half operating margin at -4.3% one way and at least +32.1% the other. (29) Against the S-1's own denominator, the revenue a $2 trillion buyer needs in year ten is about 1% to 2% of the 2025 knowledge-worker wage bill. (30) And the largest budgets belong to companies that build: Microsoft distributes Claude and builds its own, and its AI chief, Mustafa Suleyman, told Bloomberg in June, "We pay a lot of money to Anthropic, so our goal is to reduce and ultimately eliminate that cost." (31)
The second is whether the margin outruns the commitments. The S-1 sells at falling prices: Opus 5.5 cut customers' cost per task by about 40%, through "a combination of a lower price and improved efficiency," made "while preserving our margins." So far, the margin has held. (32) It buys at fixed ones: minimums with Amazon, Google and Microsoft, each "regardless of actual usage," and rent on the 2026 lease with Broadcom. That is at least $394 billion of compute at fixed minimums, most of it running to 2032 or 2033 and Amazon's to 2036. The risk section names the exposure: "we may be paying premium prices for resources that have declined in market value." The filer expects the margin to give some back as new capacity arrives, with expense "recognized in advance of the full revenue that the compute will ultimately support." The margin holds as long as efficiency keeps pace with both the price cuts and a market price for compute that falls with each hardware generation. That is the lead again, measured in cost. (33)
Who carries the credit differs too. Tuesday's reading of Meta ended there: Meta writes its own guarantees, at AA-, while most of the $63 billion of debt behind Anthropic's lease from Broadcom, which the S-1 calls its "supplier and lessor," carries Broadcom's guarantee, by The Wall Street Journal's account. The S-1 states no credit rating for Anthropic, and its $15 billion revolving credit facility stays secured by substantially all of its assets until two of Moody's, S&P and Fitch rate it investment grade and Anthropic elects to release the security. (34)
The other side of the record
The S-1 is one side of a record, and Anthropic's largest counterparties file the other: of 52 facts we track across them, each side names the other on six, and the same Amazon notes carry two fair values at June 30, $108.6 billion on Anthropic's books and about $97.9 billion on Amazon's. The full ledger follows next week. (35)
How this reading gets updated
The amendment will carry a price range, third-quarter revenue on a GAAP basis, the Run-Rate Revenue at October 31 and the blank figures in the contractual obligations table. When it files, every exhibit here re-runs on the filed figures and the filed price. At $1.5 trillion, the slowdown path with Alphabet's pace after it pays 5.2% to 7.6%, at or above a Treasury, so a lower price moves the result on the slowdown path; the year-one hinge stays. (36)
The amendment has a deadline. Under Rule 3-12 of Regulation S-X, statements dated June 30 can support an offering that becomes effective through November 12; on or after November 13 the filing needs statements for September 30, and the roadshow has been reported for the week of November 9. (37)
Its Run-Rate Revenue is the first new figure. It measures a 28-day window ending October 31, later than our base, so it prints above $67.8 billion on either path: near $75 billion if the slowdown is carrying forward, and near $88 billion at the third quarter's pace. (38)
The next two quarters show where revenue starts: about $19.5 billion and $20.4 billion on the slowdown path, about $24.8 billion and $36.4 billion at the third quarter's pace. Each filed quarter replaces a path with a figure, and the payoff re-runs on it. (39) The decade after that will take years to show.
Not knowing what a young company becomes is ordinary at an IPO, and the S-1 is candid about how little six quarters can show; the amendment will fill in much of it. The price is what makes it unusual: at $2 trillion, a buyer pays before the history that would tell the paths apart.
Free to read, no paywall. Readers who find the work useful can support it at the foot of the page; payment offsets the time and buys no access. Corrections run in daylight, dated, in a comment or in the following piece, and a reader who finds one is doing us a favor.
Standing Disclosure
Cape Fear Advisors holds no direct position, long or short, in the securities discussed here. Any exposure is indirect, through managed funds it does not control, which may include index funds holding the public companies named.
Anthropic, the subject of this piece, is the developer of Claude, which we use in preparing our work. That nearness cannot be checked away, which is why no claim here rests on trust in the tool: every figure carries a public source, and every derived figure carries its inputs in the notes and in a workbook built from formulas. Every rounding that moves a result runs in the buyer's favor and against this reading; the one rounding exception, a required multiple printed as 8.8 so that its division ties, is named in the notes. Figures are quoted from the filers without characterization, and the same standard of reading is applied to every filer named.
Notes
[1] OURS on FILED and REPORTED. Base and price per notes (4) and (5). Next four quarters per note (17): about $81.6 billion on the slowdown path and about $193 billion at the third quarter's pace, 2.37 times apart. Year ten required to match a 5.00% Treasury from $2,000 billion: $389.7 billion to $489.2 billion, per note (19). Returns by year one per note (24). Treasury: Federal Reserve H.15, 10-year constant maturity, 5.00% for October 26, 2026. Club record per note (20).
[2] OURS. "Anthropic, First Read: The Revenue Is Gross, and the Third Quarter Is a Ratio," October 26, 2026. Revenue added each quarter, from the table below: $179m, $411m, $595m, $658m, $2,691m and $6,824m; the third quarter of 2026, at 86 times, $5,387m ($5,288m to $5,486m on 85.5 to 86.5 times, rounded outward). The note also covers the next paragraph. FILED. Anthropic, PBC Form S-1, accession 0001628280-26-067168, October 26, 2026. Quarterly revenue table, Management's Discussion and Analysis: $376m, $787m, $1,382m, $2,040m, $4,731m and $11,555m for the quarters from March 2025 to June 2026; $197m for the quarter ended December 31, 2024 from the text. Headcount "grew over five times" from December 31, 2024 to September 30, 2026. "Model versions released in the six months ended September 30, 2026 accounted for over 80% of our revenue for the three months ended September 30, 2026." Risk Factors run from prospectus page 26 to 119; OURS, our first pass of October 27. Cover: "The information in this preliminary prospectus is not complete and may be changed"; "Subject To Completion. Dated ."
[3] FILED. S-1 per note (2), Prospectus Summary and Business; Industry, Market, and Other Data: "Certain estimates in this prospectus regarding global knowledge workers' wages, which we refer to as the annual economic value represented by global knowledge workers, are our own," derived from Bureau of Labor Statistics and International Labor Organization data. Searched October 29, 2026 at 13:02 UTC: "total addressable market" and "TAM" zero instances.
[4] FILED and OURS. S-1 per note (2): "our revenue for the three months ended September 30, 2026 was 86 times our revenue for the three months ended December 31, 2024." OURS: 86 x $197m is $16,942m; times four is $67,768m. "86 times" admits 85.5 to 86.5: a base of $67.4 billion to $68.2 billion and a band of 7.52 to 7.88; the Treasury hurdle moves by under 0.2 points. Run-Rate Revenue as defined in the S-1. REPORTED: Reuters, October 15, 2026, $16.8 billion. Our first read per note (2).
[5] REPORTED. Financial Times, about August 13, 2026 (via PYMNTS); Reuters, October 15, 2026, citing four people (via Investing.com); The Wall Street Journal, October 26, 2026 (via Investing.com). The New York Times reported "near $2T" on August 21. EDGAR submissions for Anthropic, PBC (CIK 0002130357) read at 13:44 UTC October 29, 2026: the S-1 of October 26 is the latest filing; no S-1/A.
[6] FILED. S-1 per note (2), Risk Factors and Description of Capital Stock: Class F "is entitled to a fixed 50.1% of the total voting power of our outstanding shares of capital stock."
[7] OURS on FILED and REPORTED. Apple (1980) and Microsoft (1986) listed before EDGAR; their prospectuses are excluded, and both enter the decade record of note (20). IPO value is the IPO price times shares outstanding after the offering, from each company's final prospectus on EDGAR, each listed with its accession in the workbook's IPO_unearned and Quarterly tabs. Last quarter before listing, annualized (NVIDIA: nine months to October 25, 1998, annualized). Price to revenue for Alphabet and Meta on market values for October 26, 2026 (REPORTED) and trailing revenue from their 10-Qs (FILED); until this week's filings the two stand on different revenue bases, Alphabet's first half doubled and Meta's trailing twelve months to September 30. Alphabet's third quarter, reported October 28 (Form 8-K, accession 0001652044-26-000080, FURNISHED), would put its trailing twelve months at $471.1 billion and the multiple at 8.15x on the same value, and its shares fell about 10% after hours (REPORTED, note (23)); either change lowers every Alphabet-end figure, so the piece keeps the October 26 ruler, which favors Anthropic. SpaceX: final prospectus, Form 424B4, accession 0001628280-26-042639, $135.00 times 13,075,865,175 Class A and Class B shares, about $1,765 billion, against its last reported quarter, $4,694 million, times four; unearned 91.1% to 92.9%, floored. Values and formulas in the workbook, IPO_unearned tab.
[8] FILED. S-1 per note (2), searched October 28, 2026: "moat" 0; "switching cost" 0; "network effect" 1; "lock-in" 1; "competitive advantage" 5.
[9] FILED. S-1 per note (2), Business, "Our Self-Reinforcing Loops"; Risk Factors.
[10] FILED. S-1 per note (2).
[11] REPORTED, read at source. Torsten Slok, "No Signs of AI Payoff Outside the Tech Sector," Apollo, The Daily Spark, October 24, 2026; companion note August 9, 2026.
[12] FILED. Google Inc. prospectus, accession 0001193125-04-143377, ten quarters to June 30, 2004; Facebook, Inc. prospectus, accession 0001193125-12-240111, nine quarters to March 31, 2012.
[13] OURS on FILED. The eight measures and every value in the workbook, Measures tab. Six of Anthropic's eight use the implied third quarter. Annualized quarterly rates compound the quarter's growth over four quarters.
[14] OURS on FILED. Band: highest over lowest growth factor, one plus the rate, which stays meaningful when a band crosses zero; Facebook's narrowest measure is -23.4%. Year after listing: the next four quarters' revenue from 10-K and XBRL company facts, expressed as the constant annual rate that produces it: Google 105.2%, Facebook 50.1%, Salesforce 82.3%, Palantir 53.8%. Not computed for Amazon and Avago. Anthropic's band endpoints print to the nearest point (362.1% as 362%, 3,458.5% as 3,459%); the comparables' range on the history face prints outward (2.61 as 2.7), the direction that narrows Anthropic's lead in width. The year-after rate is the constant quarterly rate from the last filed quarter that regenerates the next four quarters' total, annualized; the same construction gives Anthropic's implied next-four-quarter revenue, the third quarter's $16.9 billion grown at each end of its band, summed over four quarters: about $193 billion to $992 billion. Prospectus accessions per notes (7) and (12); Salesforce 0001193125-04-107098; Palantir 0001193125-20-250103. The slowdown path, about $81.6 billion over the next four quarters, per note (17).
[15] FILED. S-1 per note (2), Business: growth "accelerated from 48% for the three months ended December 31, 2025 to 132% for the three months ended March 31, 2026"; Management's Discussion and Analysis, seasonality. OURS: $11,555m over $4,731m is 144.2%; $16,942m over $11,555m is 46.6%. Risk Factors, revenue growth: "We do not expect our revenue will continue to grow at comparable rates, and we cannot assure you that it will continue to grow at all"; "We expect our revenue growth rate to decline over time. In addition, because the AI industry is very nascent, we have struggled to accurately forecast our revenue in the past and may struggle to do so in the future."
[16] FILED. S-1 per note (2), Net Revenue Retention "approximately 900%" as of September 30, 2026, as defined there.
[17] OURS on FILED. Each band recomputed on the first n quarters of each series, n from five to the full series, with the measures available at that length (five at five quarters, seven at six or seven, eight from eight). Facebook 6.00 at five quarters and 2.25 at six. From six quarters on, every comparable between 1.10 (Salesforce) and 2.61 (Google), printed outward as 1.1 to 2.7. Anthropic 2.18 (series to the fourth quarter of 2025), 6.09 (to the first quarter of 2026), 2.83 (to the second) and 7.70 (to the third, implied). Paths: slowdown, the quarterly growth rate keeping 32.3% of itself each quarter from 46.6%, gives $19.5, $20.4, $20.8 and $20.9 billion, $81.6 billion; third-quarter pace, 46.6% a quarter, gives $24.8, $36.4, $53.4 and $78.3 billion, $193.0 billion. Workbook, History tab.
[18] OURS. On the slowdown path, year one $81.58 billion, then Alphabet's pace, 18.308% a year for nine years: year-ten revenue $370.4 billion. One point more, 19.308%: $399.6 billion, $29.2 billion more; at Alphabet's 8.36x, about $244 billion more of value in year ten. Discounted at 1.05^10, the price that pays 5.00% moves from $1,901.1 billion to $2,050.7 billion, $149.6 billion more, 7.5% of $2,000 billion; printed about $29 billion and, rounded up, about $150 billion. Both figures scale with the starting revenue, which is tens of billions here against the hundreds of millions at which most of the comparables listed.
[19] OURS. Revenue in year ten = $2,000 billion x (1 + r)^10 / multiple, on the display multiples 8.36x and 6.66x: at 5%, $389.7 billion (Alphabet) to $489.2 billion (Meta); at 10%, $620.5 billion to $778.9 billion; printed floored, $389 billion to $489 billion and $620 billion to $778 billion. On the workbook's unrounded multiples the Meta figures are $488.9 billion and $778.5 billion. From the last four quarters' revenue, $35.268 billion, the 5% hurdle is 27.15% to 30.07% a year and the 10% hurdle 33.21% to 36.27%, printed floored as 27% to 30%; on the workbook's unrounded multiples the 10% Meta-end figure floors at 36.26%. The last four quarters end September 30, 2026 and year ten ends September 30, 2036, the span the year-one paths of note (24) run, so this is the like-for-like basis; today's annualized rate sets a run rate against an annual figure and favors Anthropic. FILED: Amazon net sales $34,204m in 2010 and $386,064m in 2020, SEC XBRL company facts pulled October 27, 2026. OURS: 27.43% a year, the fastest ten-year window starting at $30 billion of revenue or more among the club members with a complete one in company facts; next among Amazon's own windows, 2011 at 25.60%, then 2012, 2013 and 2014 at 23.74%, 22.68% and 21.77%; the best window of each other member with one, Apple from fiscal 2008 at 21.63%, Alphabet from 2011 at 21.12% and Microsoft from fiscal 2016 at 13.79%. Achieved rates print to the nearest hundredth. Meta (first above $30 billion in 2017), NVIDIA (fiscal 2024), Tesla (2020) and Broadcom (fiscal 2022) have no complete window from $30 billion. It clears the Alphabet-end hurdle, 27.15%, and falls short of the Meta-end, 30.07%. Microsoft's company facts begin in fiscal 2008, at $60.4 billion, so its earlier windows are not computed here. The note also covers the next paragraph. Revenue in the four quarters to September 30, 2026: $35,268m ($2,040m, $4,731m, $11,555m, $16,942m), against $2,742m a year earlier, an addition of $32,526m; next four quarters per note (17), additions of $46.3 billion and $157.7 billion. Revenue added each year at a constant rate from the $67.8 billion base: at 5%, 19.11% to 21.85% a year, printed floored as 19% to 21%, $13.0 billion to $14.8 billion in year one and $62.5 billion to $87.7 billion in year ten; at 10%, 24.78% to 27.65%, $16.8 billion to $18.7 billion in year one and $123.3 billion to $168.8 billion in year ten; rates printed floored, dollars to the nearest tenth. FILED: the largest one-year revenue gains in 10-K revenue, SEC XBRL company facts, pulled October 28, 2026, for all eight club members: Amazon $105.5 billion (2020, $386,064m against $280,522m), Apple $91.3 billion (fiscal 2021), NVIDIA $85.4 billion (fiscal 2026), Alphabet $75.1 billion (2021), Microsoft $50.1 billion (fiscal 2026), Meta $36.5 billion (2025), Tesla $27.6 billion (2022), Broadcom $15.8 billion (fiscal 2024).
[20] FILED. 10-K revenue, SEC XBRL company facts, pulled October 28, 2026 with the house User-Agent: Amazon 23.736% (2012 to 2022), Alphabet 18.308% (2015 to 2025), Apple 15.46% (fiscal 2010 to fiscal 2020), Microsoft 13.793% (fiscal 2016 to fiscal 2026). Universe: every ten-year window from the first year at $60 billion or more; Meta (first above $60 billion in 2019, $70.7 billion) and NVIDIA (fiscal 2024, $60.9 billion) have no complete window, nor do Broadcom (first above $60 billion in fiscal 2025, $63.9 billion) and Tesla (2022, $81.5 billion), per company facts pulled October 28, 2026. Amazon: net sales $61,093m in 2012 (Form 10-K, accession 0001193125-13-028520) and $513,983m in 2022 (Form 10-K, accession 0001018724-23-000004); AWS net sales $3,108m in 2013, the earliest year in the first 10-K to report the segment (accession 0001018724-16-000172), and $80,096m in 2022; advertising services $37,739m in 2022. OURS: growth $452,890m; AWS at most $80.1 billion of it (17.7%); AWS and advertising together at most $117.8 billion (26.0%), so the other lines supplied at least 73.9%. AWS launched in 2006 and Amazon sold advertising in 2012; neither was reported separately then.
[21] FILED. 10-K revenue, SEC XBRL company facts, October 28, 2026. Year-by-year growth from listing: Snowflake 124, 106, 69, 36, 29, 29; Datadog 83, 66, 71, 63, 27, 26, 28; Twilio 66, 44, 63, 75, 55, 61, 35, 9, 7, 14 (2019 and 2021 include acquisitions); Workday 104 to 13 over fourteen years; MongoDB 45, 61, 58, 40, 48, 47, 31, 19, 23; Palantir 47, 41, 24, 17, 29, 56. FILED, company facts: Meta $1.974 billion (2010) to $86.0 billion (2020), 45.85% a year; NVIDIA $5.010 billion (fiscal 2016) to $215.94 billion (fiscal 2026), 45.70%. OURS: share of growth kept each year, the geometric rate at which the growth rate fell from the first year after listing to the first year below 30%: Snowflake 124 to 29 over four years, 0.69; Datadog 83 to 27 over four, 0.75; Twilio 66 to 9 over seven, 0.75; Workday 104 to 29 over seven, 0.83; MongoDB 45 to 19 over seven, 0.88.
[22] OURS. Year one $81.6 billion to $193.0 billion, 2.37 times; nine years at 13.793% to 23.736% a year, (1.23736 / 1.13793)^9, 2.13 times; year-ten revenue from $261 billion (slowdown, then Microsoft's pace) to $1,312 billion (third-quarter pace, then Amazon's), 5.03 times. Workbook, Payoff tab, year-one rows.
[23] REPORTED. Erin Woo, "Google Shares Fall 10% as Growth in Search Revenue Slows," The Wall Street Journal, October 28, 2026, 5:43 pm ET: shares down "about 10% in after-hours trading"; search revenue growth 12% against 17% in the second quarter; services revenue $96.3 billion against analysts' expectations of $98.5 billion; Google Cloud revenue $30.7 billion, up 103%; third-quarter capital expenditures $51.4 billion and free cash flow of -$9.1 billion; the chief financial officer expects capital spending to rise significantly in 2027. The New York Times, DealBook, October 29, 2026: Alphabet shares down nearly 11% in premarket trading; Microsoft up about 1.6%, with $18.6 billion of free cash flow and $45.2 billion of capital expenditures last quarter, a broader measure than the cash figure used here. FILED: Microsoft Form 10-Q for the quarter ended September 30, 2026, accession 0001193125-26-436133: net cash from operations $58,000 million, additions to property and equipment $39,367 million; OURS: free cash flow $18,633 million. FILED: Alphabet Form 10-Q for the quarter ended September 30, 2026, accession 0001652044-26-000084, accepted 00:29 UTC October 29: Google Cloud revenues increased $15.6 billion year on year, "primarily driven by growth in Google Cloud Platform, largely from infrastructure and platform services, and TPU system sales"; purchases of property and equipment $131,953 million for nine months against $80,598 million for six (Form 10-Q, accession 0001652044-26-000071), and net cash provided by operating activities $127,149 million against $84,859 million; OURS: third quarter $51,355 million of capital spending and free cash flow of -$9,065 million, matching the Journal's figures. FURNISHED: Alphabet Form 8-K, accession 0001652044-26-000080, Exhibit 99.1, Google Services revenue $96,302 million. OURS: $96.3 billion is 2.2% below $98.5 billion. Alphabet listed in August 2004. Sequence only; the attribution of each move is the reporting outlet's.
[24] OURS. Return = ((Y1 x (1 + g)^9 x m) / P)^(1/10) - 1, with Y1 $81.6 billion or $193.0 billion per note (17), g the pace of Microsoft's (13.793%), Alphabet's (18.308%) or Amazon's (23.736%) best decade, m 6.66x or 8.36x, P $2,000 billion; flat revenue at $67.8 billion. Results, Meta's to Alphabet's multiple, rounded up: flat -13.8% to -11.8%; slowdown year one then Microsoft -1.3% to 0.9%, Alphabet 2.2% to 4.5%, Amazon 6.4% to 8.8%; third-quarter pace then Microsoft 7.5% to 10.0%, Alphabet 11.4% to 13.9%, Amazon 15.9% to 18.6%. Price that pays 5.00% with Alphabet's pace after year one: Y1 x 1.18308^9 x m / 1.05^10, every figure rounded up: on the display multiples 6.66x and 8.36x, $1,515 billion to $1,902 billion on the slowdown path and $3,583 billion to $4,497 billion at the third quarter's pace; on the workbook's unrounded multiples (6.6638x, 8.3590x), $1,516 billion to $1,901 billion and $3,585 billion to $4,497 billion. The faster path's fourth quarter, $78.3 billion, is a $313 billion annual rate; year two at Alphabet's pace is about $228 billion, so revenue steps down after year one. The construction understates that path, against Anthropic and against the buyer-favor rule; stated here rather than adjusted. Required multiple in 2036 on the slowdown path then Alphabet's pace (revenue $370.4 billion): 8.795x at 5%, $3,258 billion ($2,000 billion x 1.05^10) over $370 billion, printed 8.8x so the division ties, the one exception to the rounding rule; 14.00x at 10%. Implied ten-year rate from $67.8 billion: slowdown then Alphabet 18.51%; third-quarter pace then Alphabet 29.17%. The slowdown-then-Alphabet return at Alphabet's multiple is 4.47% against 5.00%; the multiple that closes it, 8.795x, is 5.2% above 8.359x, and the year one that closes it at 8.36x, $85.82 billion (floored, $85.8 billion), is 5.2% above $81.58 billion. Both enter year-ten value in proportion, so the two margins are the same. Other constructions of a slowdown give other year ones: the dollar additions decaying at the observed 0.789 a quarter, about $102.2 billion; the third quarter's $5.4 billion addition held flat, about $121.6 billion. Each is above the switch point; the slowdown path here is the slowest of the three. Apple's pace (15.456%), the fourth of the club's decades, gives 0.0% to 2.2% on the slowdown path (-0.0975% and 2.1997%, each rounded up: -0.09% and 2.20% at two decimals); it sits between the Microsoft and Alphabet rows and is held off the face for space. The "best pace" is each company's best ten-year window starting at $60 billion of revenue or more, per note (20); Alphabet's and Amazon's best windows from smaller bases were faster. Workbook, Payoff tab, year-one rows.
[25] FILED. S-1 per note (2), Notes 4 and 9: the convertible notes outstanding at June 30, 2026 are Amazon's, about $2.2 billion of rollover principal (2023 note purchase agreement) and $4.0 billion (2024 note purchase agreement), all non-interest bearing, at fair value $108,566m (Level 3). OURS: about $6.2 billion of principal against $108.6 billion of fair value, about 17.5 times. The best payoff cell, 18.6% a year rounded up (third-quarter pace, then Amazon's pace, at Alphabet's multiple), compounds to 1.186^10 = 5.51 times in ten years; unrounded, 18.55%, 5.48 times. Commitments per note (33).
[26] REPORTED. Aswath Damodaran, "The Anthropic IPO Arrives: My (but not the) Anthropic Valuation!", Musings on Markets, October 28, 2026, and his spreadsheet AnthropicIPO.xlsx: equity value $1.475 trillion. OURS: $1,000 billion over $67.8 billion, over ten years, is 30.9% a year.
[27] OURS on FILED. Both found in our first read per note (2). Net basis: reported revenue less the fees paid to the cloud marketplace partners, per our October 27 note on the channel fee rate, a factor of about 0.83 to 0.84 on total revenue. FILED: S-1 per note (2), Management's Discussion and Analysis: cloud marketplace revenue about 48% of revenue in the first half of 2026; sales, marketing and partnerships $3,168 million, "primarily driven by a $2.7 billion increase in fees paid to channel partners"; revenue $16,286 million. OURS: the $2.7 billion increase is read as approximately the level of fees, since marketplace sales were a small share of revenue a year earlier; fees of about $2.6 billion to $2.8 billion, about 16% to 17% of total revenue, a construction rather than a filed figure. Unearned 76.2% (0.84 at Alphabet's 8.36x) to 81.2% (0.83 at Meta's 6.66x). Net basis multiplies every (1 + return) by 0.83^0.1 at the Meta end and 0.84^0.1 at the Alphabet end, 0.9815 and 0.9827, as the net-basis range is paired (workbook, Sensitivities tab), lowering the payoff's sixteen path cells, flat revenue excluded, by 1.74 to 2.14 points a year. On the slowdown path: then Alphabet's pace, 0.3% to 2.7%; then Amazon's, 4.4% at Meta's multiple and 6.9% at Alphabet's. Endpoints rounded up. FILED: S-1 per note (2), Management's Discussion and Analysis: "we estimate that revenue from such customers represented approximately 5% to 7% of our revenue for the nine months ended September 30, 2026"; "We expect the percentage of revenue from customers using our models, platform, and applications in violation of our usage policy or commercial terms to decline in future periods." OURS: a base lower by 5% to 7% multiplies every (1 + return) by 0.95^0.1 to 0.93^0.1, lowering the same sixteen path cells, each factor applied at both ends, by about 0.50 to 0.86 points a year.
[28] REPORTED. Anthropic, "Estimating AI productivity gains from Claude conversations," November 25, 2025: 1.8 points a year over a decade, assuming universal adoption, "this isn't a prediction." Anthropic, "Anthropic Economic Index report: Economic primitives," January 15, 2026, chapter 4, read at source October 28, 2026: "from 1.8 to about 1.0 percentage points of annual labor productivity growth" after task success (1.2 for Claude.ai, 1.0 for API traffic); with complementary tasks (elasticity of substitution 0.5), "0.8pp for Claude.ai and 0.6pp for API"; with substitutable tasks (elasticity 1.5), the effect "rises to 2.2-2.6 percentage points per year." FILED: S-1 per note (2), searched October 28, 2026: "productivity growth" 0, "labor productivity" 0.
[29] OURS on FILED. Our first read per note (2): Case A and Case B for the first half of 2026. FILED, S-1 per note (2), first half of 2026: revenue $16,286 million; GAAP operating loss about $693 million, -4.3%; compute and infrastructure by nature $8,945 million; cost of revenue (Note 8) $2,380 million. OURS: compute in research and development at least $5,925 million (total compute, less cost of revenue, less the free-access compute bounded by the gap between the two sales lines); added back, an operating margin of at least +32.1%.
[30] OURS. $389.7 billion to $489.2 billion over $40 trillion is 0.97% to 1.22%; $620.5 billion to $778.9 billion is 1.55% to 1.94%. Stated against the static 2025 figure; a growing wage bill makes each share smaller.
[31] REPORTED: Mustafa Suleyman to Bloomberg, June 4, 2026 (via The Next Web).
[32] FILED. S-1 per note (2), Business and Management's Discussion and Analysis.
[33] FILED. S-1 per note (2), Liquidity and Capital Resources: Amazon at least $110.0 billion (May 2026 to April 2036); Google at least about $114.5 billion (April 2026 to July 2033); Microsoft at least $44.9 billion (November 2026 to May 2033); the 2026 Lease Arrangement with Broadcom, about $125.2 billion excluding interest, five-year terms. OURS: the four sum to $394.6 billion, printed as at least $394 billion. The Nscale and Lambda arrangements accrue fees on delivery and are excluded. Risk Factors, compute commitments. Management's Discussion and Analysis: "As significant incremental compute is brought online in future periods, the associated expense will be recognized in advance of the full revenue that the compute will ultimately support, and we expect operating margin and Adjusted Operating Margin may compress in those periods." Outside the $394 billion: an estimated $125.0 billion to $150.0 billion of additional TPU compute to be delivered from 2028 to 2031, with payments "determined by the capacity made available" and "not included in the contractual commitments table"; and short-term agreements with "minimum non-cancelable payments" of about $21 billion.
[34] OURS. "Anthropic, Adding It Up: The Growth Gap," October 27, 2026, and its notes: Meta's guarantees at AA-, and the financing behind Anthropic's 2026 lease, part of which carries Broadcom's support. REPORTED: Alexander Saeedy, Anissa Gardizy and Matt Wirz, "Broadcom CEO Intervened to Seal $63 Billion Anthropic Debt Deal," The Wall Street Journal, October 26, 2026: about $18 billion of the $63 billion of debt without a Broadcom guarantee; OURS: about $45 billion, 71%, with it. FILED: S-1 per note (2), Risk Factors: Broadcom "simultaneously serves as a supplier and lessor." FILED: S-1 per note (2), Liquidity and Capital Resources: the A&R Credit Agreement of September 2026, "a $15 billion senior secured revolving credit facility," secured by "substantially all of our assets"; guarantees and security interests are released at Anthropic's election once it has "an Investment Grade Rating (as defined in the A&R Credit Agreement) from at least two out of three of Moody's, S&P, and Fitch." Searched October 29, 2026 at 13:02 UTC: "Moody's" once, in the release condition above; "credit rating" twice, both setting fees and margins after the release; no rating for Anthropic stated.
[35] OURS on FILED. Our working ledger of who discloses what around Anthropic, probes run October 27, 2026: both name each other 6; Anthropic names, the counterparty is silent or unnamed 22; the counterparty names, Anthropic silent 7; neither 16; one row covering several partners. FILED: S-1 per note (2), Note 4 (notes at fair value $108,566m, Level 3, the only convertible notes outstanding at June 30 being Amazon's) and Note 9; Amazon Form 10-Q for the quarter ended June 30, 2026, accession 0001018724-26-000026 (fair value of its Anthropic convertible notes about $97.9 billion). S-1 Exhibit Index read at 18:38 UTC October 28, 2026: compute contracts filed, Exhibit 10.11 (Master Equipment Lease Agreement with Broadcom) only, alongside Exhibits 4.3 to 4.5 (note facilities with Amazon, Broadcom and Google). OURS: $110.0 billion plus $114.5 billion plus $44.9 billion is $269.4 billion.
[36] OURS. At $1.5 trillion, gross: slowdown then Alphabet's pace 5.2% to 7.6%, rounded up; unearned 62% to 69%, floored. Workbook, Sensitivities tab.
[37] RULE: Regulation S-X Rule 3-12(a), 17 CFR 210.3-12: where the latest balance sheet is 135 days or more before the expected effective date, the filing must include an interim balance sheet within 135 days. OURS on REPORTED: the statements must be dated within 135 days of effectiveness, so June 30 statements support an effective date up to 134 days later, November 11, 2026; November 11 is Veterans Day, a federal holiday, and under Securities Act Rule 417 the period runs to the next business day, November 12. Mayer Brown's 2026 staleness calendar gives November 12 for second-quarter statements of all other filers. REPORTED: Bloomberg, roadshow as early as the week of November 9, as cited by Olga Usvyatsky and Francine McKenna, "Anthropic's S-1: We're not quite there yet," Deep Quarry, October 29, 2026, who set out the Rule 3-12 timing. EDGAR for Anthropic, PBC (CIK 0002130357): latest filing the S-1 of October 26, read at 13:44 UTC October 29, 2026.
[38] OURS. A 28-day window ending October 31 is centered about 2.07 months after the middle of the third quarter. At the third quarter's pace, 46.62% a quarter, about 13.6% a month: $16.942 billion / 3 x 1.1361^2.07 x 12, about $88.2 billion. On the slowdown path, the fourth quarter's 15.07% spread evenly: about $74.7 billion. The S-1 multiplies 28 days by 13 and adds subscriptions times 12, so both figures are approximations to its measure. The workbook README's earlier figure, about 13% above our base, measured one month from the third quarter's end and is corrected.
[39] OURS. Quarterly paths per note (17).
Analysis: Cape Fear Advisors.
This piece also appears on Substack. Cape Fear Advisors is an independent advisory firm based in Portsmouth, NH.
Contact Cape Fear Advisors