

Apple filed its quarter this week, in the same week its largest peers filed theirs. Side by side, the filings describe two different industries. This piece reads the company the traveling chart left out, and finds the week’s most interesting balance sheet at the house that built almost nothing.
The restraint is real
The concession comes first, because it is the largest fact in the file. Apple’s restraint has been the best capital allocation decision of this cycle so far, and the record shows it without needing an argument.
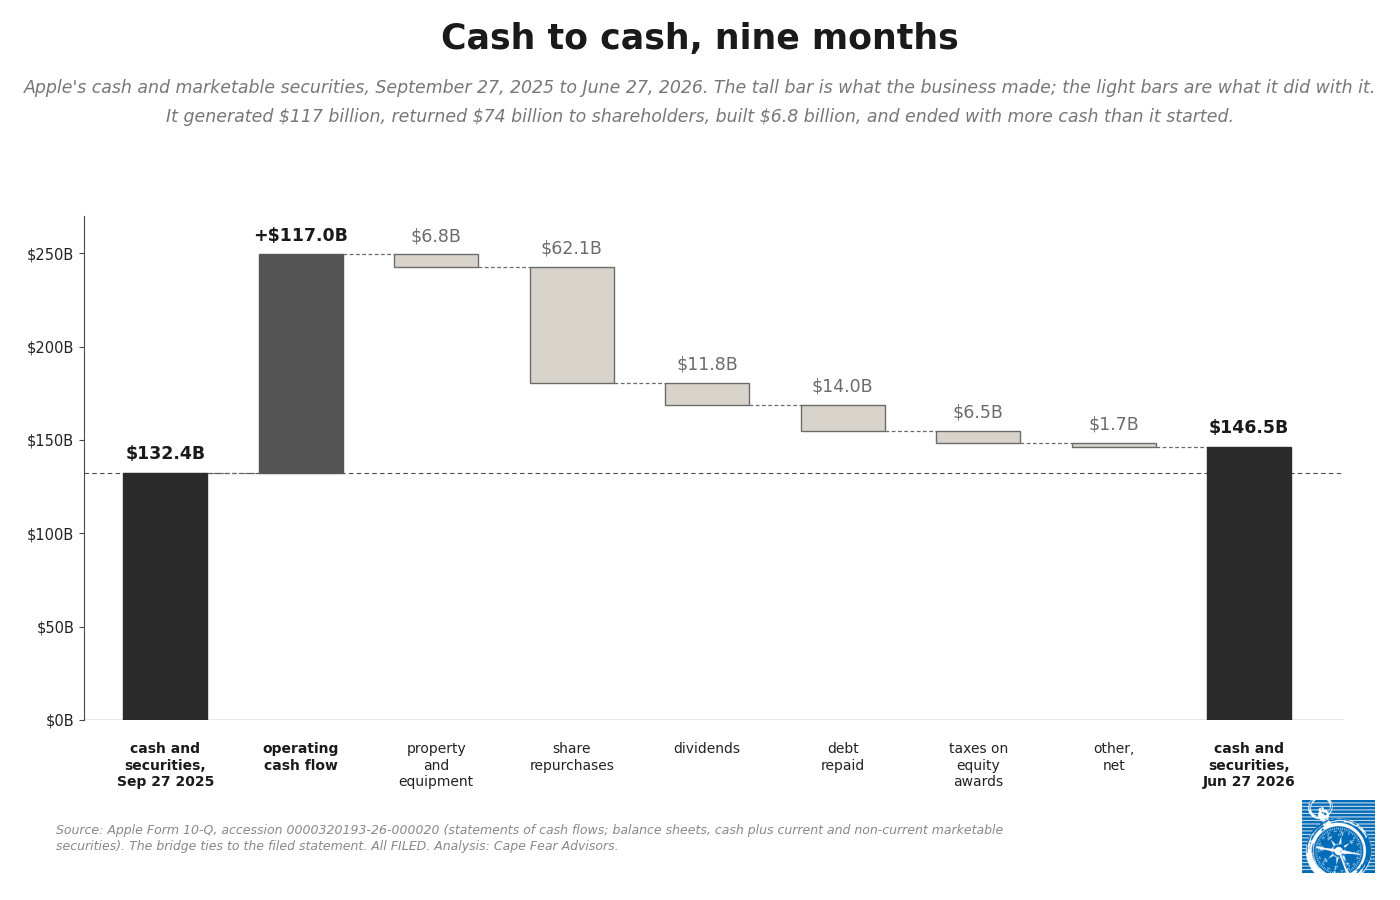
In the nine months ended June 27, Apple generated $117.0 billion of operating cash flow and spent $6.8 billion of it on property, plant and equipment. That is 5.8 percent, and it is falling: the same line ran $9.5 billion a year earlier. Over the same nine months the company repurchased $61.8 billion of stock, paid $11.8 billion of dividends, repaid $14.0 billion of debt, and issued none. The line for proceeds from debt issuance in the cash flow statement is a literal dash. Total liabilities fell from $285.5 billion to $275.7 billion. Among the seven balance sheets we read this week, it is the only one that shrank.
The scale of the abstention takes a comparison to see. On Thursday we published a piece about a chart that tried to add up what six large technology companies owe and have promised. The four companies of the ROIC framework that Microsoft’s chief executive published last week spent $357.5 billion of cash on capital in a single year, by that framework’s own count. Amazon’s purchases of property and equipment in the June quarter alone were $54.2 billion. Apple’s net property, plant and equipment, everything the company owns after depreciation, accumulated over its entire corporate life, is $51.4 billion. One company bought more building in ninety days than the other owns in total, and the second company is the more valuable of the two.
Apple was excluded from that traveling chart, and the stated boundary was a word: hyperscaler, a label Apple has not applied to itself. The filings now show what sitting outside the word looks like in numbers. The commitments tables, where a company’s future obligations print even when its balance sheet stays quiet, are flat. Unconditional purchase obligations with terms beyond a year ran $33.2 billion in December, $27.7 billion in March, $27.6 billion in June. There is no datacenter ramp in them. The one obligation that jumped, and it jumped hard, is twelve-month component supply, and that is a different story, told below.
Where Apple’s artificial intelligence spending does show is a single operating expense line. Research and development ran $11.7 billion for the quarter, up 32 percent; $34.0 billion for nine months, up 33 percent. The nine-month increase alone, $8.4 billion, exceeds the company’s entire nine-month capital expenditure. And the 10-Q says what is inside it in plain terms: the increase was driven primarily by “higher infrastructure-related costs, including investments in artificial intelligence,” with management describing a hybrid approach on this week’s call, third-party cloud capacity alongside Apple’s own facilities. The builders capitalize their intelligence; Apple expenses its rent. Same buildout, different instrument, and the difference is the whole disclosure story: a dollar of capex prints forever, on the balance sheet, in the commitments note, in depreciation for years. A dollar of R&D opex prints once and disappears into a line nobody can decompose.
The booth was built before the traffic
The reason restraint has been available to Apple, and not to the companies pouring concrete, is the position of the asset Apple already owns. The most valuable thing in Cupertino does not appear on the balance sheet at any number. It is the narrowest point between machine intelligence and a human being: the device in more than a billion pockets, and the commercial arrangements that must cross that glass to reach consumer money.
The proof that the toll operates is the oldest case in our file. Roughly $20 billion a year of search advertising economics flows from Google to Apple for default placement, a figure that surfaced through United States v. Google rather than through either company’s disclosures. It is likely the largest advertising payment in the world. Both companies have treated it as immaterial for disclosure purposes; Apple’s correspondence with the Commission on the point sits at accession 0000320193-24-000061, and we wrote in the spring about what that single word keeps out of view. Sized against this week’s filing, the immateriality is a remarkable word: at roughly $5 billion a quarter flowing through Services at very little incremental cost, the arrangement would represent roughly 21 percent of Apple’s services gross profit and nearly 14 percent of total pretax income. One counterparty, one line, neither filer sizes it, and the future of the company, the most valuable in the world this week and most weeks, turns on it more than on any product.
This is the fact the trillion chart’s argument cannot reach. That chart’s real subject, as we read it last week, was that nothing on it was hidden: every number sat in a filing, in a footnote, waiting for a reader. The twenty billion is the other kind of fact. It sits in no filing. Neither company discloses it, and no amount of reading across their pages recovers it, because it is on none of them. It is public only because a court, over objection, unsealed it. A trillion dollars that was never hidden, and beside it one relationship a fiftieth its size that is. Reading harder does not find this one. A lawsuit did.
That was the toll booth at rest. This year, three separate forces began moving through it at once: a court, a saturating channel, and a licensed intelligence with no name in the filings.
A toll booth is only a cash register with a better view. The worth was never in the assets. It was in who holds the register.
The channel stopped growing
The channel comes first, because it explains the other two. The claim is not that Apple’s revenue has stalled; revenue grew 16 percent this quarter, a June record. The claim is that the channel itself, the count of people holding the device, has stopped growing fast enough to hand anyone growth by itself, and the evidence is conduct on both sides of the booth.
Apple’s own attribution language carries the first half. Three quarters running, the 10-Q explains iPhone growth the same way: “due to higher net sales of Pro models.” Mix and price, not buyers. The direct number that would test this, unit sales, is not available: Apple stopped disclosing units beginning in fiscal 2019, at about the moment base growth stopped being the story. What remains is a levels claim, an installed base at a “new all-time high,” which is true of any base that grows at all and silent about the rate. The industry tape fills in some of the gap: IDC sees global smartphone shipments dipping in 2026. Flat industry units underneath iPhone revenue growing 21 percent is a base being farmed harder, and the farming instruments are all in this year’s record: Pro mix every quarter, retail price increases in June, an expansion of App Store advertising placements in the spring, and, announced on this week’s call, a coming iCloud+ tier for heavy users of the new Siri, intelligence itself as a subscription. Four instruments, one effect: more revenue per person, because the count of persons is doing less of the work.
The Services mix is quietly confirming the shift. Services grew 12 percent this quarter, a record $30.7 billion, a touch under the roughly 13 percent the street expected, and the composition underneath moved. The filings’ own growth-driver lists named the App Store in the first two quarters of the year and dropped it in the third, leaving advertising and cloud services to carry the line; street analysis reads the same rotation, a softening App Store take, pressured by gaming and commission changes in markets including China and Japan, picked up by faster-growing streams in iCloud, AppleCare and advertising. The rotation has a direction. It runs away from the steady commission take and toward the booth’s newer lanes: the advertising business Apple expanded this spring, and the intelligence subscription it announced this week. The most reliable toll is softening, and the operator is opening new ones.
The other side of the booth behaves the same way. Google’s traffic acquisition costs, the filed line that carries payments for placement including whatever flows to Cupertino, grew 10 percent in the June quarter while Google’s advertising revenue grew 14 and its search revenue grew 16. Traffic acquisition as a share of advertising revenue fell from 20.6 percent to 19.8. Growth is decoupling from the paid channel: Google is finding revenue that does not route through anyone’s booth, because the booth’s traffic no longer grows on its own. None of this reads as weakness in the filed lines. It reads as two companies who both concluded the same thing about the same channel at the same time, and whose conduct, unlike the channel’s size, is filed.
Into this arrangement a court inserted a clock. The remedies decision in the search case, September 2025, declined to break anything up and declined to ban the payments; it ordered instead that Google rebid its default search and AI application contracts annually. Both sides are appealing, the government because it wanted more, Google because it wanted nothing, and the payments flow while the D.C. Circuit considers it. But the standing order is the interesting object: a payment likely the largest of its kind in the world, priced for years in a locked private negotiation, now reprices every year, and the repricing mechanism arrived at the exact moment the thing being priced stopped growing. In a growing channel, an annual auction marks the toll up. In a saturated one, the auction is where the toll finally meets the flat traffic underneath it.
A line is born
Now the third force, and the reason this piece exists. Something large happened inside Apple’s balance sheet this year, it happened in three acts, one per quarter, and no filing puts a name to any of it.
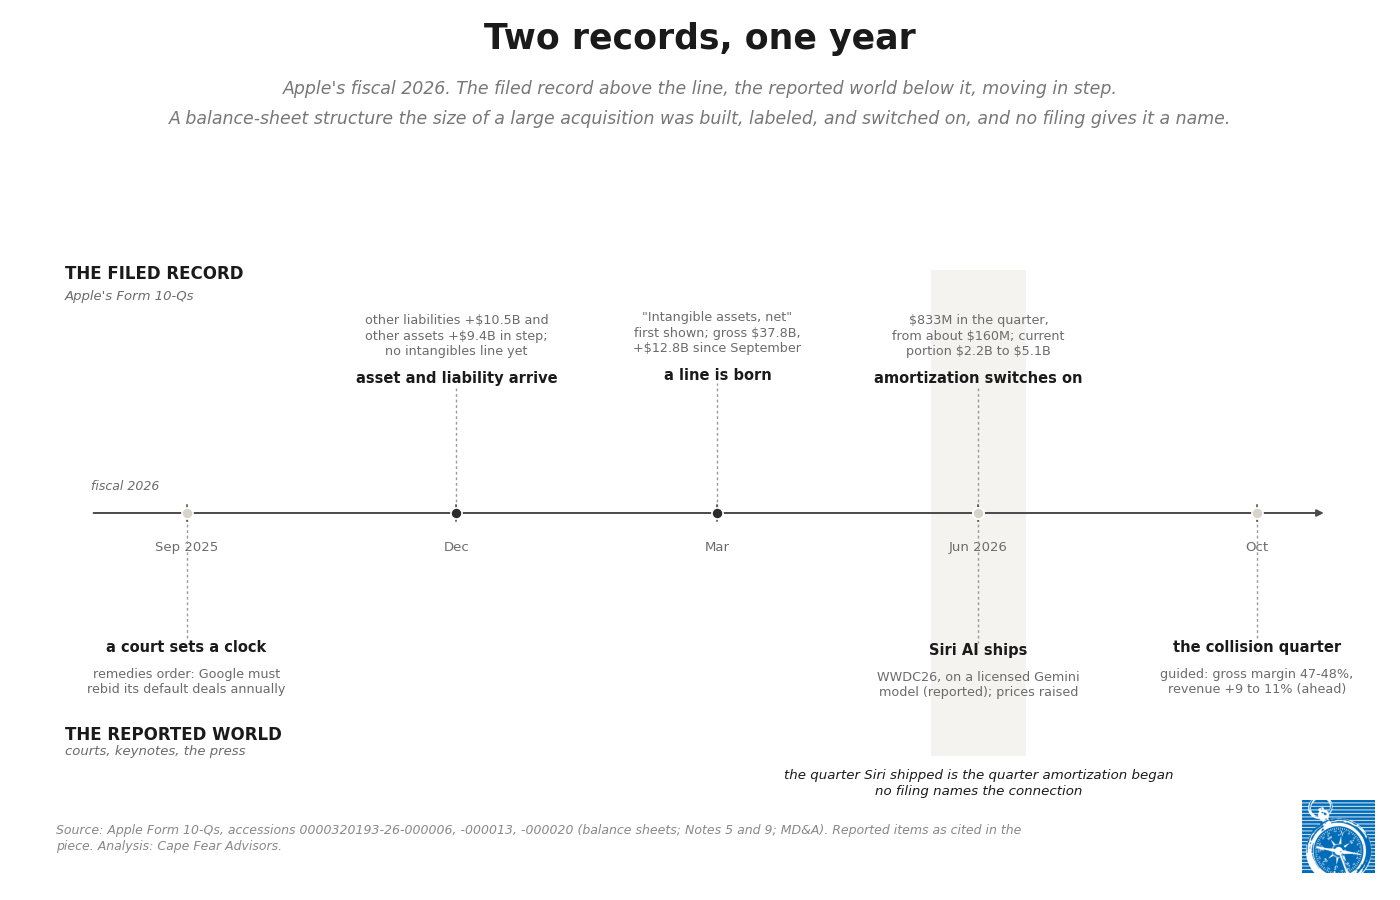
Act one is the December quarter. No line called intangible assets existed on Apple’s balance sheet; whatever the company held in that category lived inside other non-current assets, unlabeled. But two things moved together that quarter. Other non-current liabilities jumped $10.5 billion in thirteen weeks, from $41.5 billion to $52.1 billion. And the other non-current assets that would have held any new intangible grew $9.4 billion over the same weeks, in step. An asset and an obligation arrived arm in arm, and the quarter’s 10-Q flagged other purchase obligations, at $35.1 billion, as one of only two items changed materially since the annual report. Something large had been bought and financed. Nothing yet said what.
Act two is the March quarter, and it is the act a filings reader lives for: the 10-Q gives birth to a balance sheet line. “Intangible assets, net” appears for the first time, with the prior September recast to $11.1 billion, carved to the dollar out of other non-current assets. The new line arrives already grown. Gross intangible assets stand at $37.8 billion, $12.8 billion above the recast September figure, and how much of that landed in December and how much in March cannot be split, because December never showed the line. The commitments tables fell in step, unconditional purchase obligations down $5.5 billion, other purchase obligations down $4.7 billion, which is what it looks like when a promise finishes turning into a recognized asset with a recognized debt beside it. A line is born when a number grows too large for the drawer it was hiding in. This one was born in the winter, months before anything was announced on any stage.
Act three is the June quarter, the quarter Siri AI shipped. The gross balance barely moved, up less than half a billion. The amortization moved instead. It had run about $160 million a quarter on the older intangibles through the winter and spring; in the June quarter the line jumped to $833 million. Under the accounting, amortization begins when an asset is placed in service, and the size of the jump, roughly $670 million of new amortization, fits a $12.8 billion asset switched on during the quarter and written down over about five years. Capitalized in winter; placed in service at the keynote. The income statement felt it exactly where a services cost would land: services gross margin, 76.5 and 76.7 percent in the first two quarters, printed 75.6 in the third, with the MD&A offering only “higher costs,” unnamed. And the forward schedule is on the face of the filing. The current portion of intangibles, the net book value scheduled to amortize within twelve months, stands at $5.1 billion, up from $2.2 billion at the fiscal year’s start. Whatever was bought will run through Apple’s results at more than $5 billion a year, and rising, smoothly, with no cliff, no launch-quarter shock, and no name.
The structure is complete, and it is coherent. The cash flow statement shows almost nothing in investing for it, $1.8 billion of other investing outflow in nine months against a $13.3 billion gross addition, so the asset was not bought with cash. Nor is it a season of acquisitions: Apple’s purchases over the past year were the small tuck-ins it has always favored, a database team, a plug-in maker, at undisclosed and modest prices, and a bought company records as cash paid and goodwill, not as an asset with a matching payable. Its twin is the liability, up $13.5 billion over the same nine months, in step. An asset and a payable, arm in arm, cash to follow over years: the filed shape of a financed license. And the arrangement is absent from the commitments note for the most instructive reason available, because it does not belong there. A commitment is a promise off the balance sheet; this is already on it, recognized, scheduled, amortizing. Everything about the structure is disclosed. The only thing missing is every word of narrative: across three 10-Qs, the composition of the year’s largest new asset receives no sentences at all. On this week’s earnings call, management did not mention it and no analyst asked.
The shape has no name
Here our rules require a paragraph of care, and the care is part of the finding.
The filings do not name the counterparty, and they likely never will. What the record holds is a shape: a commitment in the winter, an asset and its twin liability in the spring, an amortization schedule that switched on the week a new intelligence shipped inside the flagship product. What the reported record holds, separately, is that Apple licensed a custom Gemini 3 model from Google to power the rebuilt Siri, under a multi-year agreement press accounts size at roughly a billion dollars a year. Those are two different records. Laying one over the other is speculation, and this piece labels it as such: the silhouette fits, the timing fits, and nothing filed connects them. The reader should also sit with the arithmetic that does not fit, because the distance between the two numbers is itself the finding: a filed schedule to amortize more than $5 billion a year, against a reported fee near one billion, five times over. Either the reported figure understates the arrangement badly, or other licensed property shares the line, content, intellectual property, rights of kinds the filing declines to distinguish. The record permits either. It confirms neither.
What can be said without speculation is this. If any part of that structure is the Siri arrangement, then two of the largest commercial facts about the company both run through the same counterparty, in opposite directions, and neither appears by name in either company’s financial statements. Google pays Apple roughly $20 billion a year to reach users through the device; that number lives in court filings and correspondence, not on any income statement. Apple now carries a multi-billion-dollar financed asset that makes the device intelligent; that number lives on the balance sheet with no words attached. A payment the size of a Fortune 100 company’s revenue, and an asset the size of a large acquisition, and the sum total of narrative disclosure between them is zero sentences. We wrote in the spring about materiality by silence, and named the pattern more precisely in July in the judgment calls: an unknown known, a fact already sitting on the record that a filing chooses to confirm, restate, or pass over, with the choice made where anyone can watch it. Anthropic’s version of it had the facts scattered across its counterparties’ filings while its own page stayed blank. Apple’s inverts that. The facts are on Apple’s own page, in full, and only the name sits elsewhere, in the reported world; the page that discloses the number is the same page that withholds what it is for. The silence now has a second wing.
One more filed shadow, logged without inference. A single unnamed customer inside Apple’s trade receivables grew from 12 percent of the total in September to 18 percent in June, roughly $5.7 billion, while the carriers’ collective share fell from 34 percent to 27. In the same three filings, the growth drivers named first for Services are advertising and cloud services, advertising leading every quarter. No name, sequence only. The record traces shapes; this is another one.
The collision quarter is guided
The June quarter also staged the next test, and management, to its credit, pre-registered its own numbers.
The chip story ran through the filings in an arc this year. December’s 10-Q carried no supply language at all. March’s introduced a new paragraph: supply constraints and rising component costs, NAND and DRAM named, trends expected to intensify. June’s kept the paragraph and added a sentence that converts the marketing tape into the record: “Actions, such as price increases, that have been and may in the future be taken by the Company may not effectively mitigate these negative impacts, and may also reduce demand.” The price increases announced in June, attributed on the tape to memory costs, are now in the filing as mitigation that may not work.
The June quarter was the lock-in quarter, three moves in thirteen weeks, all filed. Manufacturing purchase obligations jumped from $44.6 billion to $57.0 billion, 27 percent in one quarter, nearly all of it payable within twelve months. Components inventory ran from $2.1 billion at September to $7.6 billion, more than tripled, while finished goods sat flat, so the entire inventory build is parts. And the retail prices went up in the quarter’s final days. Buy the parts before the spike, lock the supply, raise the price. The margin arithmetic says the sequence ran ahead of the pain: products gross margin printed 40.1 percent against 34.5 a year earlier, and even assigning the entire tariff refund to hardware, the quarter cleared roughly 37, up nearly three points, at old prices, before the increases contributed a dollar. In the filed order of events, the margin went up, then the prices went up, and the costs, which reach the income statement through inventory with a lag the pre-buying just lengthened, come last. Sequence, never causation. But that is the sequence.
The fourth quarter is where price meets cost, and management drew the line itself. Revenue is guided up 9 to 11 percent; gross margin is guided to 47 to 48, down from 50.1, a range that by management’s account still carries about a point of tariff refund; and the chief financial officer told the call that memory cost changes explain more than one hundred percent of the sequential margin decline. That is a decomposition claim, stated in public, about a quarter that will print in late October, and we will read the print against it. The chief executive called the memory market a hundred-year flood and said the company reluctantly raised prices. The market, for its part, marked the guide down 7 percent the next morning and diagnosed a chips crunch in the hardware business. Perhaps. The fourth quarter will also be the first full quarter of the new prices, the first quarter of the new CEO, and the first annual report signed by John Ternus, a hardware engineer certifying a year in which the most consequential entries were a financed license, a tariff refund, and a toll under annual auction. The 10-K he signs is also the filing where the intangibles may finally receive their sentences, and where new tax disclosure rules force the first country-level detail. His first signature lands on the most interesting annual report Apple has produced in years.
Three distances from the cash register
The published framework invites one last comparison, Apple among the builders. Microsoft’s chief executive posted an application last week scoring the four large builders on return on invested capital: 29.7 percent average, all four clearing a 9 percent hurdle, capital visible, attribution not. We ran Apple through the same style of arithmetic, and the result is labeled derived, with the method in the notes: on the most conservative cut, operating profit after tax over total assets less non-interest-bearing current liabilities, Apple returns above 47 percent. On the excess-cash-adjusted cut the framework itself prefers, above 100. The company outside the frame outruns the frame’s best score by an amount that makes the hurdle line look decorative.
The distances show up in scale before they show up in returns. Oracle, the house whose place in the framework is most in question, spent about $56 billion building in its last fiscal year, more than everything Apple owns in property, plant and equipment after a lifetime of it, and it spent it into negative free cash flow of $23.7 billion, its credit rating cut in July to one notch above high yield. Oracle’s booked backlog, the revenue it has promised to deliver in years to come, is $638 billion, roughly twelve times Apple’s entire plant, and by its own filing about an eighth of that is scheduled to arrive within a year. Apple, over the same stretch, spent $6.8 billion and borrowed nothing.
At the far end of the line sit the pure participants, the neoclouds, whose invested capital is nearly all intelligence buildout and whose marginal debt priced last week above 10.5 percent effective, more than the framework’s entire hurdle, before any equity return. The full computation on filed numbers is pre-registered here and runs when the first of them prints on August 11; the test publishes either way it comes out. But the spectrum already reads in one sentence: the company that built nothing earns the most, the companies that build and blend earn the frame’s approval, and the companies that only build pay more for money than the frame says the building returns. The buildout, whoever wins it, still pays the toll at the booth, and the toll collector’s returns are the ones nobody thought to put in the frame.
The business model is the balance sheet
Apple’s total assets are $383 billion. For the most valuable company in the world, this week and most weeks, that is a modest balance sheet, and the gap between the value and the assets is the subject of this piece. What fills it is not property, which the company declines to build, and not acquisitions, which the company famously declines to make at scale. It is a business model: a hardware company whose manufacturing and marketing are so good that it collects software margins on phones and toll margins on everyone else’s software, sitting at the one point in the intelligence economy that every buildout dollar must eventually cross to reach a person.
That position is power, and this year’s filings show it exercised quietly, across the whole ecosystem. Apple can lift the price of admission and keep its margins smooth; it can be paid what is likely the largest advertising sum in the world and have both parties call it immaterial; it can capitalize a multi-billion-dollar license and give it no name; and it can do all of it while spending less on plant in nine months than one rival spends in a quarter. None of that is concealment, and none of it needs defending. It is what discretion looks like at a company large enough to set its own line for what counts as material, a size earned the hard way, by building one of the best-selling manufactured objects in history and keeping its buyer for a decade. The power is real, and the record shows it working.
The filings this year showed the model working under pressure for the first time in a while. The channel underneath it has stopped growing, and everyone at the booth knows it. The record holds every number and none of the names, and we marked which readings are filed, which are reported, and which are speculation, because that is what this shop does for the reader.
A toll booth is only a cash register with a better view. That payment is called immaterial, the asset that now answers it carries no name, and both ring through the same register: the one thing Apple owns that appears on the balance sheet at no number. The worth was never in the assets. It was in who holds the register.
Standing disclosure: Cape Fear Advisors holds no position, long or short, in any company named in this piece, and every filed figure re-derives from the cited filings’ own tables, stated so a reader can reproduce it. This analysis is prepared with the support of AI systems, including Claude; Claude’s developer, Anthropic, is a recurring subject of our coverage of the buildout described here and a counterparty to companies named in it, the neoclouds that contract its capacity among them. That nearness cannot be checked away, which is why no claim here rests on the tool: each figure carries a public source, the record grades the rest, and the same standard of reading is applied to every filer named. A separate nearness: the author’s operating business works in advertising measurement, which sits near the advertising economics discussed here, and the reader should weigh that adjacency. Earnings-call quotations are taken from transcript services and labeled reported pending the official replay; if the replay differs, a dated correction will follow, by name.
This piece is also available on Substack.
Notes
Apple figures. All Apple filed figures are from the fiscal 2026 Form 10-Qs, accessions 0000320193-26-000006 (quarter ended December 27, 2025), 0000320193-26-000013 (March 28, 2026), and 0000320193-26-000020 (June 27, 2026, accepted July 31, 06:01 ET), and the results Form 8-K, accession 0000320193-26-000018 (accepted July 30, 16:30 ET). The intangibles trilogy: gross intangible assets $24,950 million at September 27, 2025 (as first presented in the March 10-Q, which recast September to break the line out of other non-current assets), $37,767 million at March 28, $38,220 million at June 27; accumulated amortization $11,649, $11,970, and $12,803 million at the same dates; current portion $5,075 million at June 27. Other non-current liabilities $41,549, $52,055, $55,546, and $55,080 million across the four balance sheet dates. Purchase obligation figures are from each 10-Q’s commitments note and MD&A. Percentages are floored where rounding could favor the argument; dollar figures take accurate one-decimal rounding. The $61.8 billion of repurchases is Note 7’s own stated figure; the cash-flow statement carries the same repurchases at $62.1 billion on a settlement basis, and the cash exhibit uses that figure.
The seven balance sheets. The comparison is to the six companies of last week’s chart plus Apple, each at its most recent filed balance sheet: Apple (June 27, 2026), Microsoft (June 30, 2026), Meta (June 30, 2026), Amazon (June 30, 2026), and Alphabet (June 30, 2026) all printed within the past two weeks; Nvidia (April 26, 2026) and Oracle (May 31, 2026) are the most recent each has filed, and the differing vintages are named here so the reader can weigh them. Total liabilities rose at all six over their own prior periods and fell only at Apple, from $285.5 billion at September 27, 2025 to $275.7 billion; Nvidia’s, the smallest of the seven, still rose from $49.5 billion to $64.0 billion, and the others by more.
The CEO transition. Form 8-K, accession 0001140361-26-015711: Tim Cook to Executive Chair and John Ternus appointed chief executive officer effective September 1, 2026.
The ISA sizing. The roughly $20 billion annual figure for Google’s default payments is from the record of United States v. Google and subsequent reporting; it appears in neither company’s financial statements. Apple’s correspondence on materiality is accession 0000320193-24-000061. The quarterly sizing against services gross profit and pretax income is our arithmetic on the June quarter’s tables and is illustrative of scale, not a filed allocation.
The remedies posture. The September 2025 remedies decision ordered annual rebidding of default search and AI application contracts; the Department of Justice and states appealed February 3, 2026, Google appealed in May, and arguments at the D.C. Circuit are expected later this year (Search Engine Land). Payments continue during the appeals.
The Gemini reporting. The arrangement for Apple to license a custom Google Gemini model for the rebuilt Siri, at an estimated roughly $1 billion per year, was first reported in early November 2025 by Bloomberg (Mark Gurman) and others (9to5Mac; MacRumors), reported again in January 2026 (CNBC), and the reimagined Siri shipped at WWDC26 in June; terms are undisclosed. The identification of the balance sheet structure with this arrangement is speculation and is labeled as such in the body; no filing connects them.
Apple’s acquisitions. Apple’s trailing-year acquisitions were small tuck-ins at undisclosed prices, among them a Final Cut Pro plug-in maker (MotionVFX, March 2026) and a graph-database team (Kuzu, February 2026), reported and quantified in no filing; Apple has never disclosed an acquisition approaching the scale of the intangibles addition. That acquisitions do not account for the addition is established from the cash-flow statement, which caps all nine-month investing outflow other than securities and property at $1.8 billion.
Alphabet figures. Traffic acquisition costs of $16,179 million and Google advertising revenues of $81,629 million for the June 2026 quarter, against $14,705 million and $71,340 million a year earlier, are from Alphabet’s second quarter 2026 results release (Exhibit 99.1 to the Form 8-K). Google Search and other revenues grew 16 percent on the same tables.
The framework. The return on invested capital figures for the four builders are from the application posted publicly by Microsoft’s chief executive on July 30, 2026, built on Morgan Stanley research by Brian Nowak; both are credited as the framework’s sources. The Apple derivation in this piece uses annualized June quarter operating income taxed at the quarter’s effective rate, over invested capital computed two ways: total assets less accounts payable, other current liabilities, and deferred revenue; and the same less cash and marketable securities. Both inputs are from the June 10-Q’s tables. The figures are derived, not filed, and floored.
The scale comparison. Oracle’s approximately $56 billion of fiscal 2026 capital expenditures, negative $23.7 billion of free cash flow, and $638 billion of remaining performance obligations, of which the filing expects to recognize approximately 12 percent within twelve months, are from Oracle’s Form 10-K for the fiscal year ended May 31, 2026, accession 0001193125-26-277521, and the June 10, 2026 results release. The July 9, 2026 downgrade to BBB-, one notch above high yield, is S&P Global Ratings, reported. The neoclouds’ marginal borrowing cost above 10.5 percent effective is the CoreWeave delayed-draw term loan repriced the week of July 27, 2026, reported; the filed computation is pre-registered for CoreWeave’s August 11 print. Apple’s $6.8 billion of nine-month capital expenditure and $51.4 billion of net property, plant and equipment are from the June 10-Q.
The call. Quotations from the July 30 earnings call (“more than 100 percent of the sequential gross margin decline”; the hundred-year flood; reluctantly raised prices; the September-quarter guide of 47 to 48 percent gross margin and 9 to 11 percent revenue growth) are via transcript services (Six Colors; GuruFocus; MarketBeat); cross-verified across independent transcripts and consistent, reported pending Apple’s official replay.
The street context. Consensus figures (revenue near $108.9 billion, earnings near $1.89, Services growth near 13 percent) and the App Store mix reading are as reported by Investing.com’s coverage of the quarter; reported, not filed.
The units tape. Apple last disclosed unit sales in fiscal 2018 and stopped beginning fiscal 2019. IDC’s 2026 shipment outlook is as reported (Yahoo Finance).
Sources. Apple: 0000320193-26-000006, 0000320193-26-000013, 0000320193-26-000020, 0000320193-26-000018, 0001140361-26-015711, 0000320193-24-000061. Alphabet: second quarter 2026 results exhibit. Amazon second quarter 2026 results: 0001018724-26-000024. Oracle: 0001193125-26-277521. Accession numbers are the bibliography and need no links.
Analysis: Cape Fear Advisors.